Blackfeet vs Immigrants from Czechoslovakia Male Poverty
COMPARE
Blackfeet
Immigrants from Czechoslovakia
Male Poverty
Male Poverty Comparison
Blackfeet
Immigrants from Czechoslovakia
14.0%
MALE POVERTY
0.0/ 100
METRIC RATING
298th/ 347
METRIC RANK
10.0%
MALE POVERTY
98.6/ 100
METRIC RATING
53rd/ 347
METRIC RANK
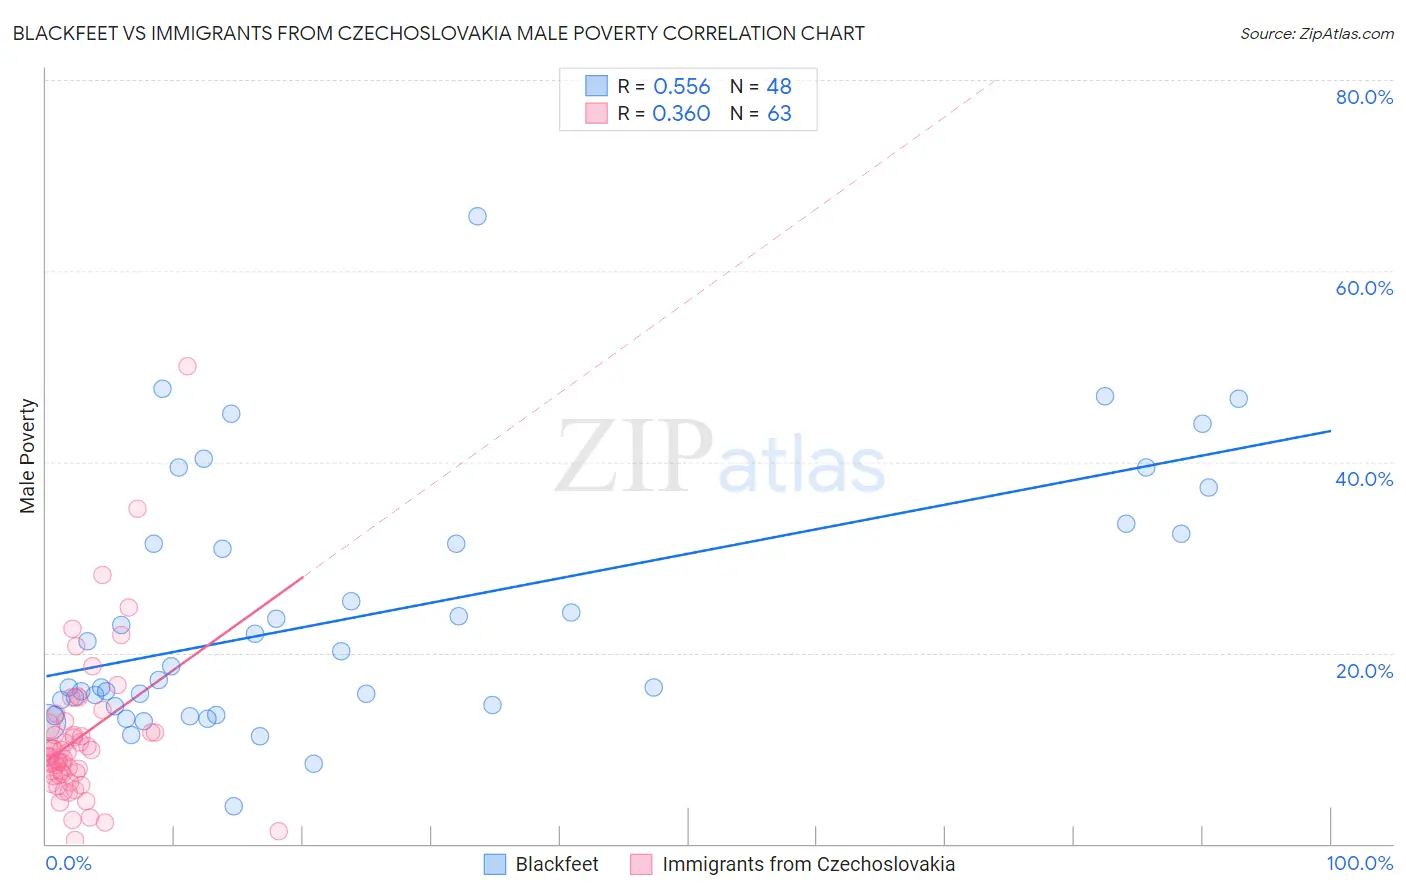
Blackfeet vs Immigrants from Czechoslovakia Male Poverty Correlation Chart
The statistical analysis conducted on geographies consisting of 309,436,017 people shows a substantial positive correlation between the proportion of Blackfeet and poverty level among males in the United States with a correlation coefficient (R) of 0.556 and weighted average of 14.0%. Similarly, the statistical analysis conducted on geographies consisting of 195,424,226 people shows a mild positive correlation between the proportion of Immigrants from Czechoslovakia and poverty level among males in the United States with a correlation coefficient (R) of 0.360 and weighted average of 10.0%, a difference of 39.7%.
Male Poverty Correlation Summary
| Measurement | Blackfeet | Immigrants from Czechoslovakia |
| Minimum | 3.9% | 0.44% |
| Maximum | 65.7% | 50.0% |
| Range | 61.8% | 49.6% |
| Mean | 23.9% | 11.2% |
| Median | 17.9% | 9.2% |
| Interquartile 25% (IQ1) | 14.4% | 7.2% |
| Interquartile 75% (IQ3) | 31.9% | 12.2% |
| Interquartile Range (IQR) | 17.5% | 5.0% |
| Standard Deviation (Sample) | 13.2% | 8.0% |
| Standard Deviation (Population) | 13.0% | 7.9% |
Similar Demographics by Male Poverty
Demographics Similar to Blackfeet by Male Poverty
In terms of male poverty, the demographic groups most similar to Blackfeet are Inupiat (14.0%, a difference of 0.030%), Immigrants from Guatemala (14.0%, a difference of 0.10%), Immigrants from Mexico (14.0%, a difference of 0.22%), Immigrants from Senegal (14.0%, a difference of 0.29%), and Immigrants from Caribbean (14.0%, a difference of 0.34%).
| Demographics | Rating | Rank | Male Poverty |
| Vietnamese | 0.0 /100 | #291 | Tragic 13.8% |
| Indonesians | 0.0 /100 | #292 | Tragic 13.8% |
| Immigrants | Belize | 0.0 /100 | #293 | Tragic 13.8% |
| Hispanics or Latinos | 0.0 /100 | #294 | Tragic 13.9% |
| Immigrants | Central America | 0.0 /100 | #295 | Tragic 13.9% |
| Cajuns | 0.0 /100 | #296 | Tragic 13.9% |
| Inupiat | 0.0 /100 | #297 | Tragic 14.0% |
| Blackfeet | 0.0 /100 | #298 | Tragic 14.0% |
| Immigrants | Guatemala | 0.0 /100 | #299 | Tragic 14.0% |
| Immigrants | Mexico | 0.0 /100 | #300 | Tragic 14.0% |
| Immigrants | Senegal | 0.0 /100 | #301 | Tragic 14.0% |
| Immigrants | Caribbean | 0.0 /100 | #302 | Tragic 14.0% |
| Bahamians | 0.0 /100 | #303 | Tragic 14.1% |
| Senegalese | 0.0 /100 | #304 | Tragic 14.1% |
| Immigrants | Bangladesh | 0.0 /100 | #305 | Tragic 14.1% |
Demographics Similar to Immigrants from Czechoslovakia by Male Poverty
In terms of male poverty, the demographic groups most similar to Immigrants from Czechoslovakia are Asian (10.0%, a difference of 0.070%), Immigrants from Croatia (10.0%, a difference of 0.16%), Immigrants from Philippines (10.0%, a difference of 0.27%), Immigrants from Austria (10.0%, a difference of 0.28%), and Slovene (10.0%, a difference of 0.32%).
| Demographics | Rating | Rank | Male Poverty |
| Turks | 98.9 /100 | #46 | Exceptional 10.0% |
| Immigrants | Singapore | 98.8 /100 | #47 | Exceptional 10.0% |
| Immigrants | Japan | 98.8 /100 | #48 | Exceptional 10.0% |
| Slovenes | 98.8 /100 | #49 | Exceptional 10.0% |
| Immigrants | Philippines | 98.7 /100 | #50 | Exceptional 10.0% |
| Immigrants | Croatia | 98.7 /100 | #51 | Exceptional 10.0% |
| Asians | 98.7 /100 | #52 | Exceptional 10.0% |
| Immigrants | Czechoslovakia | 98.6 /100 | #53 | Exceptional 10.0% |
| Immigrants | Austria | 98.5 /100 | #54 | Exceptional 10.0% |
| Germans | 98.3 /100 | #55 | Exceptional 10.1% |
| Immigrants | Bulgaria | 98.2 /100 | #56 | Exceptional 10.1% |
| Estonians | 98.1 /100 | #57 | Exceptional 10.1% |
| Scandinavians | 98.0 /100 | #58 | Exceptional 10.1% |
| Immigrants | Europe | 97.9 /100 | #59 | Exceptional 10.1% |
| Ukrainians | 97.9 /100 | #60 | Exceptional 10.1% |