Thai vs Immigrants from Asia Male Poverty
COMPARE
Thai
Immigrants from Asia
Male Poverty
Male Poverty Comparison
Thais
Immigrants from Asia
8.7%
MALE POVERTY
100.0/ 100
METRIC RATING
3rd/ 347
METRIC RANK
10.2%
MALE POVERTY
97.0/ 100
METRIC RATING
73rd/ 347
METRIC RANK
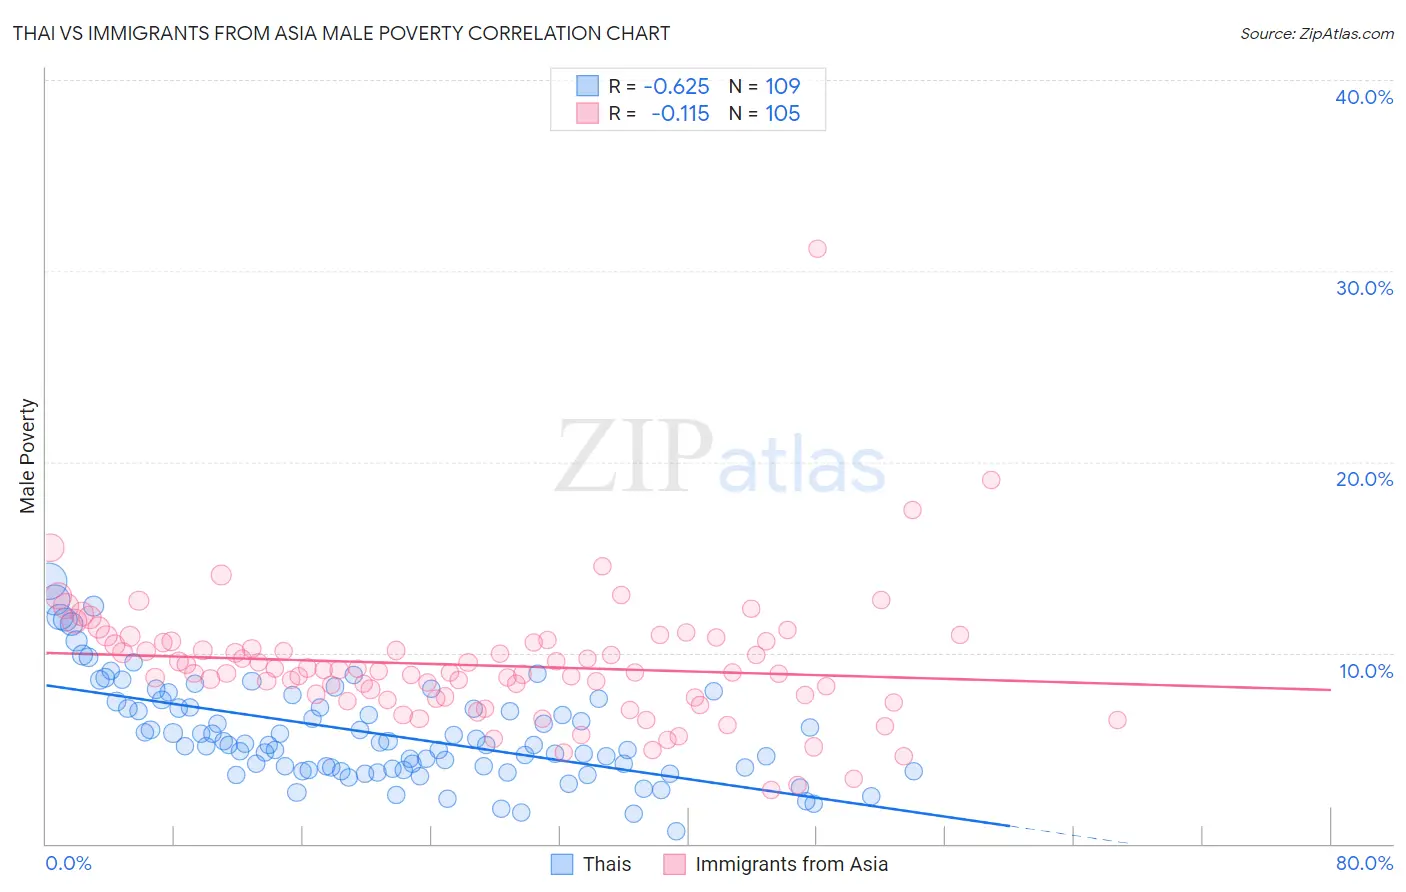
Thai vs Immigrants from Asia Male Poverty Correlation Chart
The statistical analysis conducted on geographies consisting of 475,089,189 people shows a significant negative correlation between the proportion of Thais and poverty level among males in the United States with a correlation coefficient (R) of -0.625 and weighted average of 8.7%. Similarly, the statistical analysis conducted on geographies consisting of 547,932,841 people shows a poor negative correlation between the proportion of Immigrants from Asia and poverty level among males in the United States with a correlation coefficient (R) of -0.115 and weighted average of 10.2%, a difference of 17.8%.
Male Poverty Correlation Summary
| Measurement | Thai | Immigrants from Asia |
| Minimum | 0.62% | 2.8% |
| Maximum | 13.7% | 31.2% |
| Range | 13.1% | 28.3% |
| Mean | 5.8% | 9.3% |
| Median | 5.2% | 9.0% |
| Interquartile 25% (IQ1) | 3.9% | 7.6% |
| Interquartile 75% (IQ3) | 7.3% | 10.6% |
| Interquartile Range (IQR) | 3.4% | 3.0% |
| Standard Deviation (Sample) | 2.6% | 3.4% |
| Standard Deviation (Population) | 2.6% | 3.4% |
Similar Demographics by Male Poverty
Demographics Similar to Thais by Male Poverty
In terms of male poverty, the demographic groups most similar to Thais are Chinese (8.7%, a difference of 0.080%), Immigrants from Taiwan (8.9%, a difference of 2.3%), Maltese (9.1%, a difference of 4.3%), Assyrian/Chaldean/Syriac (9.1%, a difference of 5.1%), and Immigrants from Ireland (9.1%, a difference of 5.1%).
| Demographics | Rating | Rank | Male Poverty |
| Immigrants | India | 100.0 /100 | #1 | Exceptional 8.2% |
| Chinese | 100.0 /100 | #2 | Exceptional 8.7% |
| Thais | 100.0 /100 | #3 | Exceptional 8.7% |
| Immigrants | Taiwan | 100.0 /100 | #4 | Exceptional 8.9% |
| Maltese | 100.0 /100 | #5 | Exceptional 9.1% |
| Assyrians/Chaldeans/Syriacs | 99.9 /100 | #6 | Exceptional 9.1% |
| Immigrants | Ireland | 99.9 /100 | #7 | Exceptional 9.1% |
| Filipinos | 99.9 /100 | #8 | Exceptional 9.2% |
| Immigrants | South Central Asia | 99.9 /100 | #9 | Exceptional 9.3% |
| Bulgarians | 99.9 /100 | #10 | Exceptional 9.3% |
| Bolivians | 99.9 /100 | #11 | Exceptional 9.4% |
| Immigrants | Bolivia | 99.9 /100 | #12 | Exceptional 9.4% |
| Immigrants | Lithuania | 99.9 /100 | #13 | Exceptional 9.4% |
| Immigrants | North Macedonia | 99.8 /100 | #14 | Exceptional 9.4% |
| Bhutanese | 99.8 /100 | #15 | Exceptional 9.5% |
Demographics Similar to Immigrants from Asia by Male Poverty
In terms of male poverty, the demographic groups most similar to Immigrants from Asia are Immigrants from Eastern Europe (10.2%, a difference of 0.070%), Immigrants from Canada (10.2%, a difference of 0.080%), Carpatho Rusyn (10.2%, a difference of 0.080%), Dutch (10.2%, a difference of 0.080%), and European (10.2%, a difference of 0.090%).
| Demographics | Rating | Rank | Male Poverty |
| Serbians | 97.5 /100 | #66 | Exceptional 10.2% |
| Immigrants | Netherlands | 97.3 /100 | #67 | Exceptional 10.2% |
| Immigrants | Sri Lanka | 97.2 /100 | #68 | Exceptional 10.2% |
| Immigrants | Australia | 97.1 /100 | #69 | Exceptional 10.2% |
| Paraguayans | 97.1 /100 | #70 | Exceptional 10.2% |
| Europeans | 97.1 /100 | #71 | Exceptional 10.2% |
| Immigrants | Canada | 97.1 /100 | #72 | Exceptional 10.2% |
| Immigrants | Asia | 97.0 /100 | #73 | Exceptional 10.2% |
| Immigrants | Eastern Europe | 96.9 /100 | #74 | Exceptional 10.2% |
| Carpatho Rusyns | 96.9 /100 | #75 | Exceptional 10.2% |
| Dutch | 96.9 /100 | #76 | Exceptional 10.2% |
| Immigrants | Belgium | 96.8 /100 | #77 | Exceptional 10.3% |
| Irish | 96.8 /100 | #78 | Exceptional 10.3% |
| Immigrants | North America | 96.5 /100 | #79 | Exceptional 10.3% |
| English | 96.4 /100 | #80 | Exceptional 10.3% |