Swiss vs South African Family Poverty
COMPARE
Swiss
South African
Family Poverty
Family Poverty Comparison
Swiss
South Africans
7.7%
FAMILY POVERTY
98.8/ 100
METRIC RATING
53rd/ 347
METRIC RANK
8.2%
FAMILY POVERTY
93.4/ 100
METRIC RATING
116th/ 347
METRIC RANK
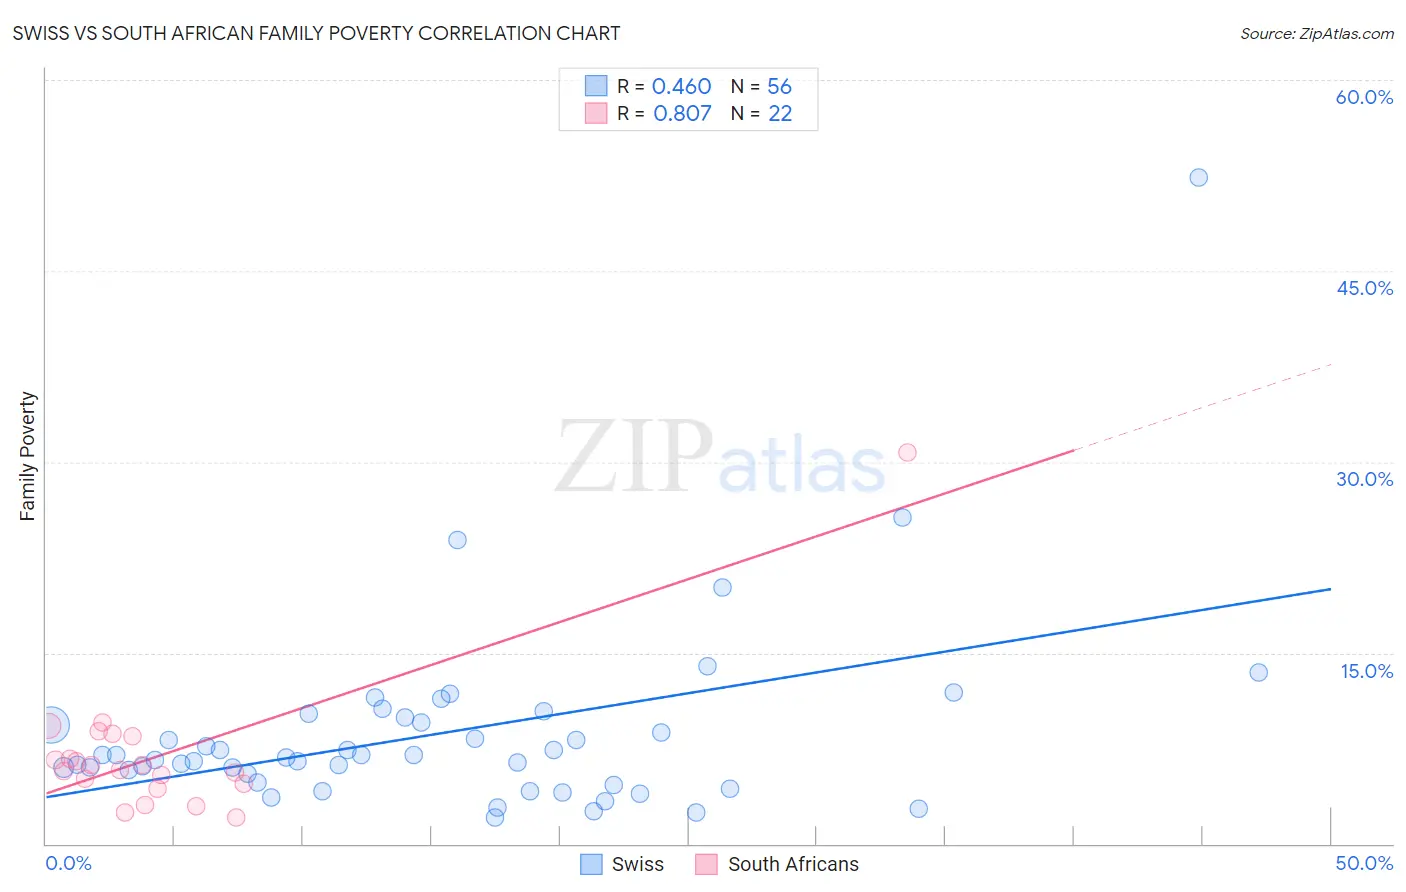
Swiss vs South African Family Poverty Correlation Chart
The statistical analysis conducted on geographies consisting of 462,917,875 people shows a moderate positive correlation between the proportion of Swiss and poverty level among families in the United States with a correlation coefficient (R) of 0.460 and weighted average of 7.7%. Similarly, the statistical analysis conducted on geographies consisting of 182,354,069 people shows a very strong positive correlation between the proportion of South Africans and poverty level among families in the United States with a correlation coefficient (R) of 0.807 and weighted average of 8.2%, a difference of 6.6%.
Family Poverty Correlation Summary
| Measurement | Swiss | South African |
| Minimum | 2.1% | 2.1% |
| Maximum | 52.4% | 30.8% |
| Range | 50.3% | 28.7% |
| Mean | 8.6% | 7.0% |
| Median | 6.9% | 6.0% |
| Interquartile 25% (IQ1) | 5.1% | 4.8% |
| Interquartile 75% (IQ3) | 9.7% | 8.4% |
| Interquartile Range (IQR) | 4.6% | 3.7% |
| Standard Deviation (Sample) | 7.6% | 5.7% |
| Standard Deviation (Population) | 7.5% | 5.6% |
Similar Demographics by Family Poverty
Demographics Similar to Swiss by Family Poverty
In terms of family poverty, the demographic groups most similar to Swiss are Immigrants from Sweden (7.7%, a difference of 0.010%), Immigrants from Eastern Asia (7.7%, a difference of 0.040%), Indian (Asian) (7.7%, a difference of 0.060%), Immigrants from Serbia (7.7%, a difference of 0.080%), and Asian (7.7%, a difference of 0.17%).
| Demographics | Rating | Rank | Family Poverty |
| Tongans | 98.9 /100 | #46 | Exceptional 7.7% |
| Immigrants | Czechoslovakia | 98.9 /100 | #47 | Exceptional 7.7% |
| Immigrants | Sri Lanka | 98.9 /100 | #48 | Exceptional 7.7% |
| Immigrants | Bolivia | 98.9 /100 | #49 | Exceptional 7.7% |
| Immigrants | North Macedonia | 98.9 /100 | #50 | Exceptional 7.7% |
| Immigrants | Moldova | 98.8 /100 | #51 | Exceptional 7.7% |
| Indians (Asian) | 98.8 /100 | #52 | Exceptional 7.7% |
| Swiss | 98.8 /100 | #53 | Exceptional 7.7% |
| Immigrants | Sweden | 98.8 /100 | #54 | Exceptional 7.7% |
| Immigrants | Eastern Asia | 98.7 /100 | #55 | Exceptional 7.7% |
| Immigrants | Serbia | 98.7 /100 | #56 | Exceptional 7.7% |
| Asians | 98.7 /100 | #57 | Exceptional 7.7% |
| Finns | 98.7 /100 | #58 | Exceptional 7.7% |
| Europeans | 98.7 /100 | #59 | Exceptional 7.7% |
| Immigrants | Greece | 98.7 /100 | #60 | Exceptional 7.7% |
Demographics Similar to South Africans by Family Poverty
In terms of family poverty, the demographic groups most similar to South Africans are Immigrants from Israel (8.2%, a difference of 0.060%), Immigrants from Russia (8.2%, a difference of 0.070%), Immigrants from Western Europe (8.2%, a difference of 0.26%), French (8.3%, a difference of 0.33%), and Immigrants from Zimbabwe (8.2%, a difference of 0.41%).
| Demographics | Rating | Rank | Family Poverty |
| Jordanians | 94.8 /100 | #109 | Exceptional 8.2% |
| Romanians | 94.7 /100 | #110 | Exceptional 8.2% |
| Taiwanese | 94.6 /100 | #111 | Exceptional 8.2% |
| Immigrants | France | 94.4 /100 | #112 | Exceptional 8.2% |
| Canadians | 94.2 /100 | #113 | Exceptional 8.2% |
| Immigrants | Zimbabwe | 94.0 /100 | #114 | Exceptional 8.2% |
| Immigrants | Israel | 93.5 /100 | #115 | Exceptional 8.2% |
| South Africans | 93.4 /100 | #116 | Exceptional 8.2% |
| Immigrants | Russia | 93.2 /100 | #117 | Exceptional 8.2% |
| Immigrants | Western Europe | 92.9 /100 | #118 | Exceptional 8.2% |
| French | 92.8 /100 | #119 | Exceptional 8.3% |
| Immigrants | Egypt | 91.6 /100 | #120 | Exceptional 8.3% |
| Native Hawaiians | 91.3 /100 | #121 | Exceptional 8.3% |
| Paraguayans | 91.2 /100 | #122 | Exceptional 8.3% |
| Palestinians | 91.1 /100 | #123 | Exceptional 8.3% |