Swiss vs Immigrants from Costa Rica Family Poverty
COMPARE
Swiss
Immigrants from Costa Rica
Family Poverty
Family Poverty Comparison
Swiss
Immigrants from Costa Rica
7.7%
FAMILY POVERTY
98.8/ 100
METRIC RATING
53rd/ 347
METRIC RANK
9.4%
FAMILY POVERTY
21.7/ 100
METRIC RATING
200th/ 347
METRIC RANK
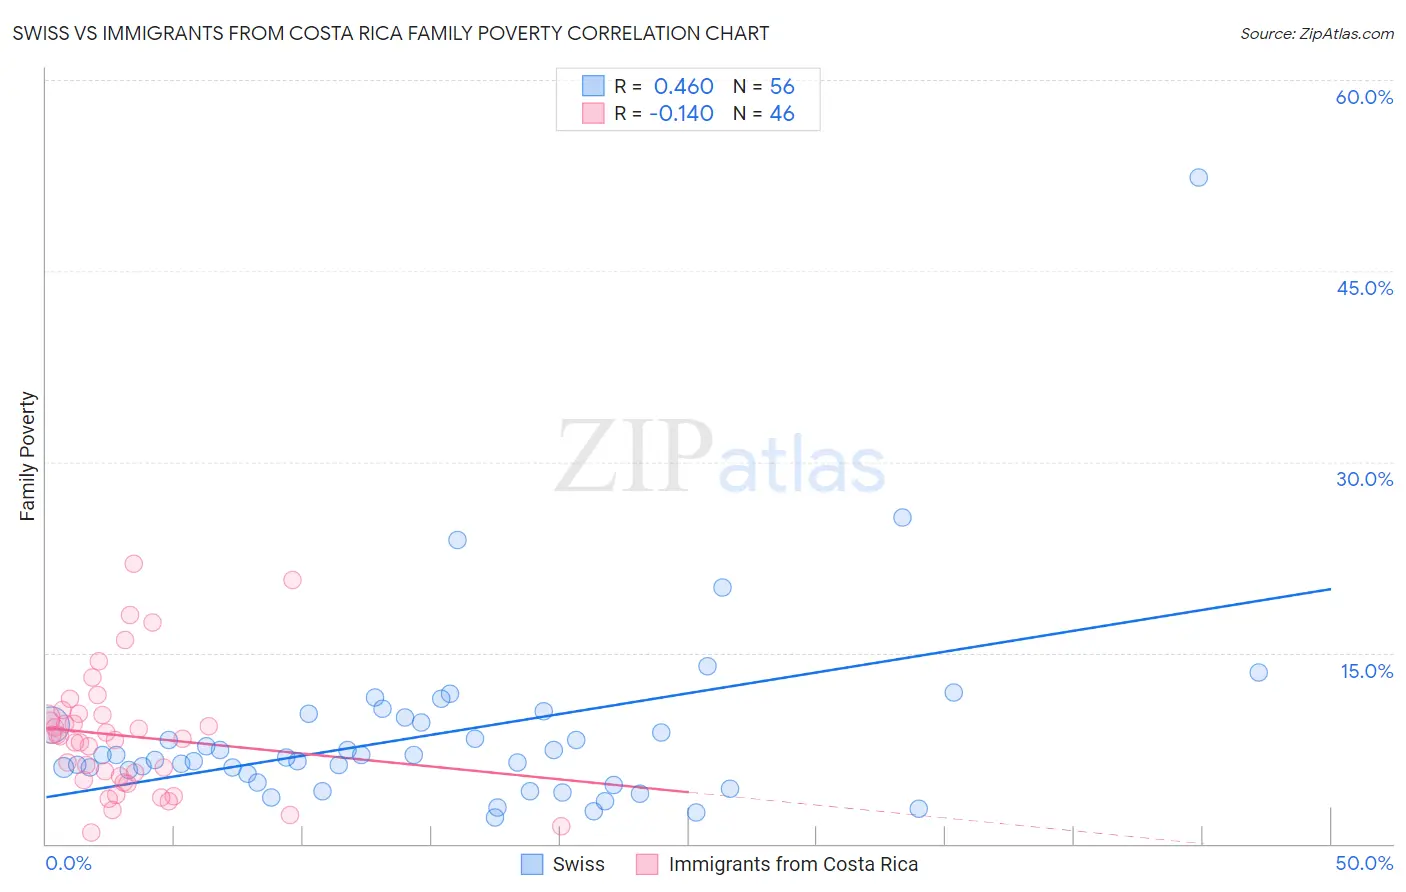
Swiss vs Immigrants from Costa Rica Family Poverty Correlation Chart
The statistical analysis conducted on geographies consisting of 462,917,875 people shows a moderate positive correlation between the proportion of Swiss and poverty level among families in the United States with a correlation coefficient (R) of 0.460 and weighted average of 7.7%. Similarly, the statistical analysis conducted on geographies consisting of 204,115,485 people shows a poor negative correlation between the proportion of Immigrants from Costa Rica and poverty level among families in the United States with a correlation coefficient (R) of -0.140 and weighted average of 9.4%, a difference of 21.6%.
Family Poverty Correlation Summary
| Measurement | Swiss | Immigrants from Costa Rica |
| Minimum | 2.1% | 0.92% |
| Maximum | 52.4% | 22.0% |
| Range | 50.3% | 21.1% |
| Mean | 8.6% | 8.5% |
| Median | 6.9% | 8.4% |
| Interquartile 25% (IQ1) | 5.1% | 5.0% |
| Interquartile 75% (IQ3) | 9.7% | 10.2% |
| Interquartile Range (IQR) | 4.6% | 5.1% |
| Standard Deviation (Sample) | 7.6% | 4.8% |
| Standard Deviation (Population) | 7.5% | 4.7% |
Similar Demographics by Family Poverty
Demographics Similar to Swiss by Family Poverty
In terms of family poverty, the demographic groups most similar to Swiss are Immigrants from Sweden (7.7%, a difference of 0.010%), Immigrants from Eastern Asia (7.7%, a difference of 0.040%), Indian (Asian) (7.7%, a difference of 0.060%), Immigrants from Serbia (7.7%, a difference of 0.080%), and Asian (7.7%, a difference of 0.17%).
| Demographics | Rating | Rank | Family Poverty |
| Tongans | 98.9 /100 | #46 | Exceptional 7.7% |
| Immigrants | Czechoslovakia | 98.9 /100 | #47 | Exceptional 7.7% |
| Immigrants | Sri Lanka | 98.9 /100 | #48 | Exceptional 7.7% |
| Immigrants | Bolivia | 98.9 /100 | #49 | Exceptional 7.7% |
| Immigrants | North Macedonia | 98.9 /100 | #50 | Exceptional 7.7% |
| Immigrants | Moldova | 98.8 /100 | #51 | Exceptional 7.7% |
| Indians (Asian) | 98.8 /100 | #52 | Exceptional 7.7% |
| Swiss | 98.8 /100 | #53 | Exceptional 7.7% |
| Immigrants | Sweden | 98.8 /100 | #54 | Exceptional 7.7% |
| Immigrants | Eastern Asia | 98.7 /100 | #55 | Exceptional 7.7% |
| Immigrants | Serbia | 98.7 /100 | #56 | Exceptional 7.7% |
| Asians | 98.7 /100 | #57 | Exceptional 7.7% |
| Finns | 98.7 /100 | #58 | Exceptional 7.7% |
| Europeans | 98.7 /100 | #59 | Exceptional 7.7% |
| Immigrants | Greece | 98.7 /100 | #60 | Exceptional 7.7% |
Demographics Similar to Immigrants from Costa Rica by Family Poverty
In terms of family poverty, the demographic groups most similar to Immigrants from Costa Rica are Spaniard (9.4%, a difference of 0.19%), Immigrants from Portugal (9.4%, a difference of 0.23%), Immigrants from Sierra Leone (9.4%, a difference of 0.40%), Iraqi (9.3%, a difference of 0.44%), and German Russian (9.4%, a difference of 0.44%).
| Demographics | Rating | Rank | Family Poverty |
| Immigrants | Western Asia | 28.2 /100 | #193 | Fair 9.3% |
| South Americans | 28.1 /100 | #194 | Fair 9.3% |
| Venezuelans | 27.4 /100 | #195 | Fair 9.3% |
| Immigrants | Venezuela | 26.1 /100 | #196 | Fair 9.3% |
| Immigrants | Colombia | 24.4 /100 | #197 | Fair 9.3% |
| Iraqis | 24.2 /100 | #198 | Fair 9.3% |
| Spaniards | 22.8 /100 | #199 | Fair 9.4% |
| Immigrants | Costa Rica | 21.7 /100 | #200 | Fair 9.4% |
| Immigrants | Portugal | 20.5 /100 | #201 | Fair 9.4% |
| Immigrants | Sierra Leone | 19.6 /100 | #202 | Poor 9.4% |
| German Russians | 19.4 /100 | #203 | Poor 9.4% |
| Immigrants | Lebanon | 18.9 /100 | #204 | Poor 9.4% |
| Aleuts | 18.0 /100 | #205 | Poor 9.5% |
| Immigrants | South America | 18.0 /100 | #206 | Poor 9.5% |
| Sierra Leoneans | 15.6 /100 | #207 | Poor 9.5% |