Sri Lankan vs Yakama Female Poverty

COMPARE

Sri Lankan
Race
Ancestry
AfghanAfricanAlaska NativeAlaskan AthabascanAlbanianAleutAlsatianAmericanApacheArabArapahoArgentineanArmenianAssyrian/Chaldean/SyriacAustralianAustrianBahamianBangladeshiBarbadianBasqueBelgianBelizeanBermudanBhutaneseBlackfeetBolivianBrazilianBritishBritish West IndianBulgarianBurmeseCajunCambodianCanadianCape VerdeanCarpatho RusynCelticCentral AmericanCentral American IndianCherokeeCheyenneChickasawChileanChineseChippewaChoctawColombianColvilleComancheCosta RicanCreeCreekCroatianCrowCubanCypriotCzechCzechoslovakianDanishDelawareDominicanDutchDutch West IndianEastern EuropeanEcuadorianEgyptianEnglishEstonianEthiopianEuropeanFijianFilipinoFinnishFrenchFrench American IndianFrench CanadianGermanGerman RussianGhanaianGreekGuamanian/ChamorroGuatemalanGuyaneseHaitianHmongHonduranHopiHoumaHungarianIcelanderIndian (Asian)IndonesianInupiatIranianIraqiIrishIroquoisIsraeliItalianJamaicanJapaneseJordanianKenyanKiowaKoreanLaotianLatvianLebaneseLiberianLithuanianLumbeeLuxembourgerMacedonianMalaysianMalteseMarshalleseMenomineeMexicanMexican American IndianMongolianMoroccanNative HawaiianNavajoNepaleseNew ZealanderNicaraguanNigerianNorthern EuropeanNorwegianOkinawanOsageOttawaPaiutePakistaniPalestinianPanamanianParaguayanPennsylvania GermanPeruvianPimaPolishPortuguesePotawatomiPuebloPuerto RicanPuget Sound SalishRomanianRussianSalvadoranSamoanScandinavianScotch-IrishScottishSeminoleSenegaleseSerbianShoshoneSierra LeoneanSiouxSlavicSlovakSloveneSomaliSouth AfricanSouth AmericanSouth American IndianSoviet UnionSpaniardSpanishSpanish AmericanSpanish American IndianSri LankanSubsaharan AfricanSudaneseSwedishSwissSyrianTaiwaneseThaiTlingit-HaidaTohono O'OdhamTonganTrinidadian and TobagonianTsimshianTurkishU.S. Virgin IslanderUgandanUkrainianUruguayanUteVenezuelanVietnameseWelshWest IndianYaquiYugoslavianYumanYup'ikZimbabwean
Immigration
NonimmigrantsImmigrantsAfghanistanAfricaAlbaniaArgentinaArmeniaAsiaAustraliaAustriaBahamasBangladeshBarbadosBelarusBelgiumBelizeBoliviaBosnia and HerzegovinaBrazilBulgariaBurma/MyanmarCabo VerdeCambodiaCameroonCanadaCaribbeanCentral AmericaChileChinaColombiaCongoCosta RicaCroatiaCubaCzechoslovakiaDenmarkDominicaDominican RepublicEastern AfricaEastern AsiaEastern EuropeEcuadorEgyptEl SalvadorEnglandEritreaEthiopiaEuropeFijiFranceGermanyGhanaGreeceGrenadaGuatemalaGuyanaHaitiHondurasHong KongHungaryIndiaIndonesiaIranIraqIrelandIsraelItalyJamaicaJapanJordanKazakhstanKenyaKoreaKuwaitLaosLatin AmericaLatviaLebanonLiberiaLithuaniaMalaysiaMexicoMicronesiaMiddle AfricaMoldovaMoroccoNepalNetherlandsNicaraguaNigeriaNorth AmericaNorth MacedoniaNorthern AfricaNorthern EuropeNorwayOceaniaPakistanPanamaPeruPhilippinesPolandPortugalRomaniaRussiaSaudi ArabiaScotlandSenegalSerbiaSierra LeoneSingaporeSomaliaSouth AfricaSouth AmericaSouth Central AsiaSouth Eastern AsiaSouthern EuropeSpainSri LankaSt. Vincent and the GrenadinesSudanSwedenSwitzerlandSyriaTaiwanThailandTrinidad and TobagoTurkeyUgandaUkraineUruguayUzbekistanVenezuelaVietnamWest IndiesWestern AfricaWestern AsiaWestern EuropeYemenZaireZimbabweAzores
Yakama
Race
Ancestry
AfghanAfricanAlaska NativeAlaskan AthabascanAlbanianAleutAlsatianAmericanApacheArabArapahoArgentineanArmenianAssyrian/Chaldean/SyriacAustralianAustrianBahamianBangladeshiBarbadianBasqueBelgianBelizeanBermudanBhutaneseBlackfeetBolivianBrazilianBritishBritish West IndianBulgarianBurmeseCajunCambodianCanadianCape VerdeanCarpatho RusynCelticCentral AmericanCentral American IndianCherokeeCheyenneChickasawChileanChineseChippewaChoctawColombianColvilleComancheCosta RicanCreeCreekCroatianCrowCubanCypriotCzechCzechoslovakianDanishDelawareDominicanDutchDutch West IndianEastern EuropeanEcuadorianEgyptianEnglishEstonianEthiopianEuropeanFijianFilipinoFinnishFrenchFrench American IndianFrench CanadianGermanGerman RussianGhanaianGreekGuamanian/ChamorroGuatemalanGuyaneseHaitianHmongHonduranHopiHoumaHungarianIcelanderIndian (Asian)IndonesianInupiatIranianIraqiIrishIroquoisIsraeliItalianJamaicanJapaneseJordanianKenyanKiowaKoreanLaotianLatvianLebaneseLiberianLithuanianLumbeeLuxembourgerMacedonianMalaysianMalteseMarshalleseMenomineeMexicanMexican American IndianMongolianMoroccanNative HawaiianNavajoNepaleseNew ZealanderNicaraguanNigerianNorthern EuropeanNorwegianOkinawanOsageOttawaPaiutePakistaniPalestinianPanamanianParaguayanPennsylvania GermanPeruvianPimaPolishPortuguesePotawatomiPuebloPuerto RicanPuget Sound SalishRomanianRussianSalvadoranSamoanScandinavianScotch-IrishScottishSeminoleSenegaleseSerbianShoshoneSierra LeoneanSiouxSlavicSlovakSloveneSomaliSouth AfricanSouth AmericanSouth American IndianSoviet UnionSpaniardSpanishSpanish AmericanSpanish American IndianSubsaharan AfricanSudaneseSwedishSwissSyrianTaiwaneseThaiTlingit-HaidaTohono O'OdhamTonganTrinidadian and TobagonianTsimshianTurkishU.S. Virgin IslanderUgandanUkrainianUruguayanUteVenezuelanVietnameseWelshWest IndianYakamaYaquiYugoslavianYumanYup'ikZimbabwean
Immigration
NonimmigrantsImmigrantsAfghanistanAfricaAlbaniaArgentinaArmeniaAsiaAustraliaAustriaBahamasBangladeshBarbadosBelarusBelgiumBelizeBoliviaBosnia and HerzegovinaBrazilBulgariaBurma/MyanmarCabo VerdeCambodiaCameroonCanadaCaribbeanCentral AmericaChileChinaColombiaCongoCosta RicaCroatiaCubaCzechoslovakiaDenmarkDominicaDominican RepublicEastern AfricaEastern AsiaEastern EuropeEcuadorEgyptEl SalvadorEnglandEritreaEthiopiaEuropeFijiFranceGermanyGhanaGreeceGrenadaGuatemalaGuyanaHaitiHondurasHong KongHungaryIndiaIndonesiaIranIraqIrelandIsraelItalyJamaicaJapanJordanKazakhstanKenyaKoreaKuwaitLaosLatin AmericaLatviaLebanonLiberiaLithuaniaMalaysiaMexicoMicronesiaMiddle AfricaMoldovaMoroccoNepalNetherlandsNicaraguaNigeriaNorth AmericaNorth MacedoniaNorthern AfricaNorthern EuropeNorwayOceaniaPakistanPanamaPeruPhilippinesPolandPortugalRomaniaRussiaSaudi ArabiaScotlandSenegalSerbiaSierra LeoneSingaporeSomaliaSouth AfricaSouth AmericaSouth Central AsiaSouth Eastern AsiaSouthern EuropeSpainSri LankaSt. Vincent and the GrenadinesSudanSwedenSwitzerlandSyriaTaiwanThailandTrinidad and TobagoTurkeyUgandaUkraineUruguayUzbekistanVenezuelaVietnamWest IndiesWestern AfricaWestern AsiaWestern EuropeYemenZaireZimbabweAzores
Female Poverty
Income
Poverty
Unemployment
Labor Participation
Family Structure
Vehicle Availability
Education Level
Disability

Female Poverty Comparison

Sri Lankans

Yakama

Exceptional
Tragic
12.7%
FEMALE POVERTY
90.9/ 100
METRIC RATING
118th/ 347
METRIC RANK
18.0%
FEMALE POVERTY
0.0/ 100
METRIC RATING
327th/ 347
METRIC RANK

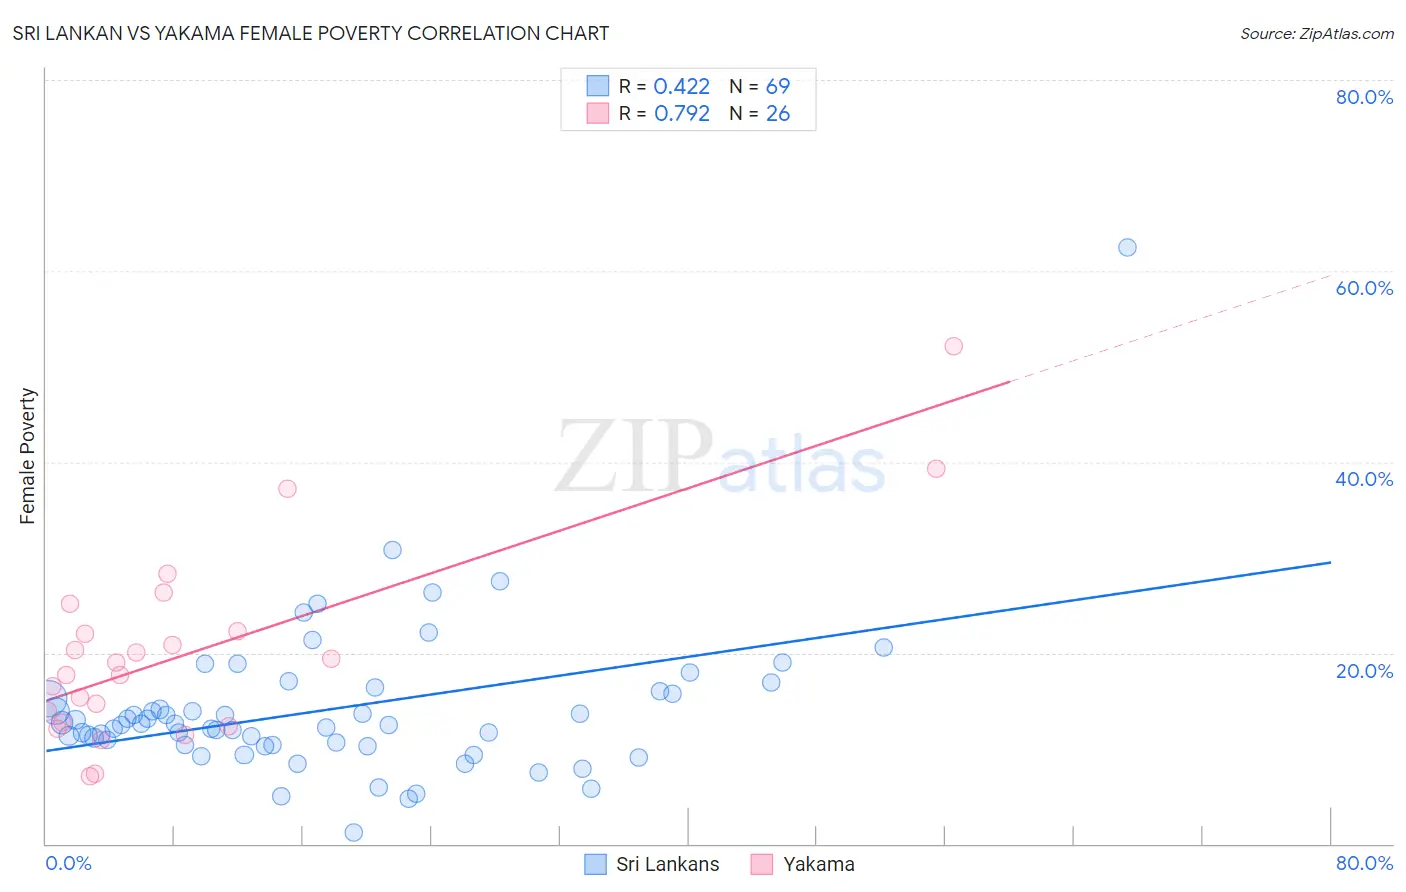
Sri Lankan vs Yakama Female Poverty Correlation Chart

The statistical analysis conducted on geographies consisting of 440,042,655 people shows a moderate positive correlation between the proportion of Sri Lankans and poverty level among females in the United States with a correlation coefficient (R) of 0.422 and weighted average of 12.7%. Similarly, the statistical analysis conducted on geographies consisting of 19,917,707 people shows a strong positive correlation between the proportion of Yakama and poverty level among females in the United States with a correlation coefficient (R) of 0.792 and weighted average of 18.0%, a difference of 42.1%.
Sri Lankan vs Yakama Female Poverty

Female Poverty Correlation Summary

MeasurementSri LankanYakama
Minimum1.2%7.1%
Maximum62.5%52.1%
Range61.3%44.9%
Mean14.0%20.1%
Median12.5%18.4%
Interquartile 25% (IQ1)10.3%12.8%
Interquartile 75% (IQ3)15.8%22.2%
Interquartile Range (IQR)5.5%9.5%
Standard Deviation (Sample)8.1%10.2%
Standard Deviation (Population)8.0%10.0%

Similar Demographics by Female Poverty

Demographics Similar to Sri Lankans by Female Poverty

In terms of female poverty, the demographic groups most similar to Sri Lankans are Albanian (12.7%, a difference of 0.010%), Immigrants from Southern Europe (12.7%, a difference of 0.020%), New Zealander (12.7%, a difference of 0.070%), Immigrants from Russia (12.7%, a difference of 0.090%), and Immigrants from Hungary (12.7%, a difference of 0.17%).
DemographicsRating | RankFemale Poverty
Soviet Union
92.4
/100
|
#111
Exceptional
12.6%
Immigrants | Israel
92.0
/100
|
#112
Exceptional
12.6%
Canadians
92.0
/100
|
#113
Exceptional
12.7%
Welsh
91.6
/100
|
#114
Exceptional
12.7%
Puget Sound Salish
91.5
/100
|
#115
Exceptional
12.7%
Immigrants | Russia
91.2
/100
|
#116
Exceptional
12.7%
Immigrants | Southern Europe
90.9
/100
|
#117
Exceptional
12.7%
Sri Lankans
90.9
/100
|
#118
Exceptional
12.7%
Albanians
90.8
/100
|
#119
Exceptional
12.7%
New Zealanders
90.6
/100
|
#120
Exceptional
12.7%
Immigrants | Hungary
90.3
/100
|
#121
Exceptional
12.7%
French Canadians
90.2
/100
|
#122
Exceptional
12.7%
Immigrants | South Eastern Asia
89.9
/100
|
#123
Excellent
12.7%
Immigrants | Norway
89.3
/100
|
#124
Excellent
12.8%
Argentineans
89.1
/100
|
#125
Excellent
12.8%

Demographics Similar to Yakama by Female Poverty

In terms of female poverty, the demographic groups most similar to Yakama are Central American Indian (18.0%, a difference of 0.10%), Colville (17.8%, a difference of 1.6%), Immigrants from Honduras (17.7%, a difference of 1.8%), Paiute (17.7%, a difference of 2.0%), and Menominee (17.6%, a difference of 2.6%).
DemographicsRating | RankFemale Poverty
Immigrants | Dominica
0.0
/100
|
#320
Tragic
17.5%
Arapaho
0.0
/100
|
#321
Tragic
17.5%
Menominee
0.0
/100
|
#322
Tragic
17.6%
Paiute
0.0
/100
|
#323
Tragic
17.7%
Immigrants | Honduras
0.0
/100
|
#324
Tragic
17.7%
Colville
0.0
/100
|
#325
Tragic
17.8%
Central American Indians
0.0
/100
|
#326
Tragic
18.0%
Yakama
0.0
/100
|
#327
Tragic
18.0%
Blacks/African Americans
0.0
/100
|
#328
Tragic
18.6%
Kiowa
0.0
/100
|
#329
Tragic
18.6%
Dominicans
0.0
/100
|
#330
Tragic
19.1%
Natives/Alaskans
0.0
/100
|
#331
Tragic
19.2%
Apache
0.0
/100
|
#332
Tragic
19.2%
Immigrants | Dominican Republic
0.0
/100
|
#333
Tragic
19.3%
Houma
0.0
/100
|
#334
Tragic
20.0%