Sri Lankan vs Immigrants from Jordan Female Poverty
COMPARE
Sri Lankan
Immigrants from Jordan
Female Poverty
Female Poverty Comparison
Sri Lankans
Immigrants from Jordan
12.7%
FEMALE POVERTY
90.9/ 100
METRIC RATING
118th/ 347
METRIC RANK
12.8%
FEMALE POVERTY
86.9/ 100
METRIC RATING
132nd/ 347
METRIC RANK
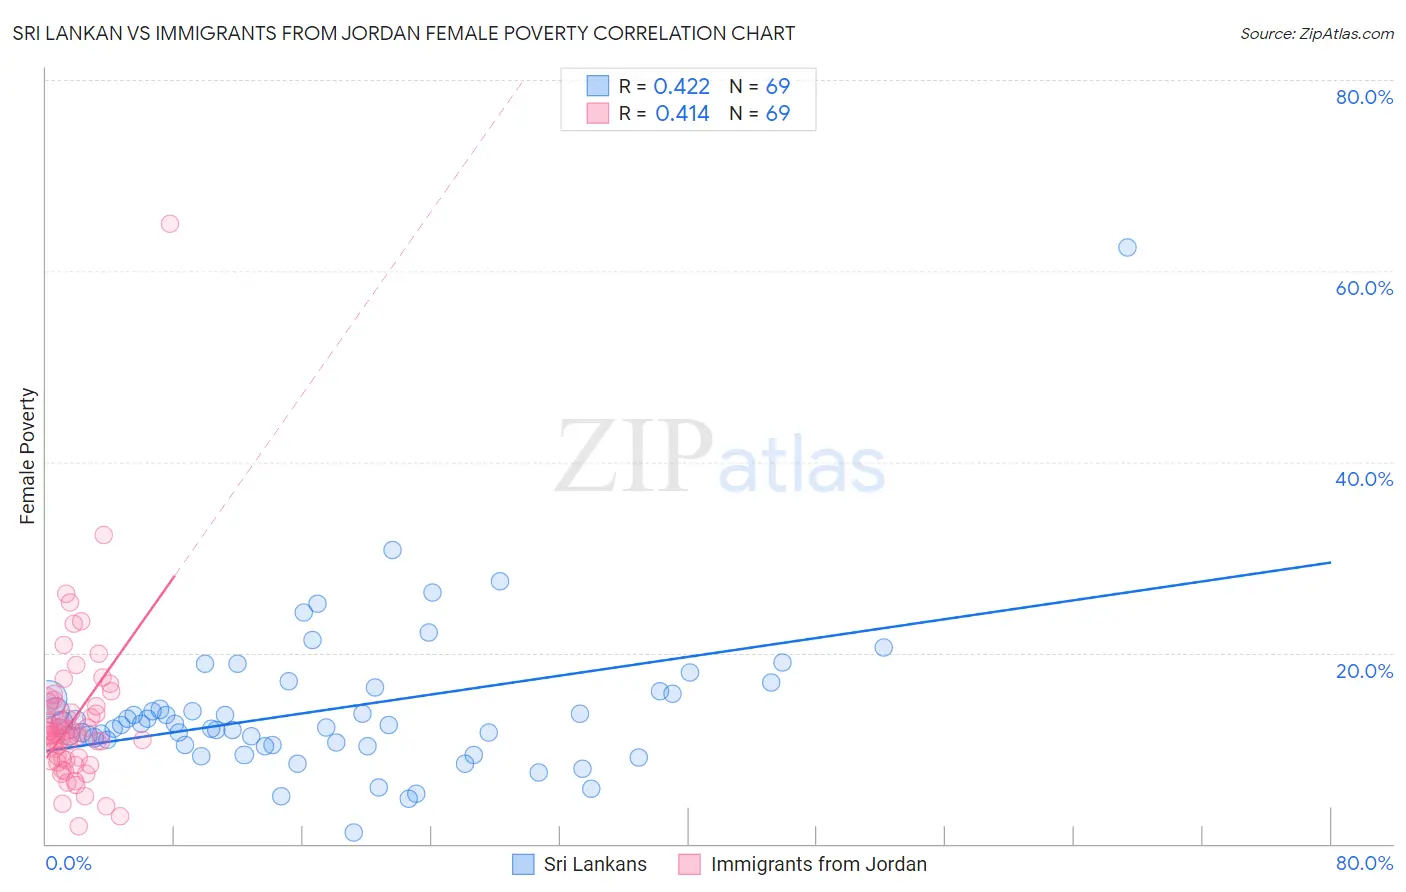
Sri Lankan vs Immigrants from Jordan Female Poverty Correlation Chart
The statistical analysis conducted on geographies consisting of 440,042,655 people shows a moderate positive correlation between the proportion of Sri Lankans and poverty level among females in the United States with a correlation coefficient (R) of 0.422 and weighted average of 12.7%. Similarly, the statistical analysis conducted on geographies consisting of 181,244,945 people shows a moderate positive correlation between the proportion of Immigrants from Jordan and poverty level among females in the United States with a correlation coefficient (R) of 0.414 and weighted average of 12.8%, a difference of 1.0%.
Female Poverty Correlation Summary
| Measurement | Sri Lankan | Immigrants from Jordan |
| Minimum | 1.2% | 1.8% |
| Maximum | 62.5% | 64.9% |
| Range | 61.3% | 63.1% |
| Mean | 14.0% | 13.0% |
| Median | 12.5% | 11.7% |
| Interquartile 25% (IQ1) | 10.3% | 8.8% |
| Interquartile 75% (IQ3) | 15.8% | 14.5% |
| Interquartile Range (IQR) | 5.5% | 5.7% |
| Standard Deviation (Sample) | 8.1% | 8.4% |
| Standard Deviation (Population) | 8.0% | 8.3% |
Demographics Similar to Sri Lankans and Immigrants from Jordan by Female Poverty
In terms of female poverty, the demographic groups most similar to Sri Lankans are Albanian (12.7%, a difference of 0.010%), Immigrants from Southern Europe (12.7%, a difference of 0.020%), New Zealander (12.7%, a difference of 0.070%), Immigrants from Russia (12.7%, a difference of 0.090%), and Immigrants from Hungary (12.7%, a difference of 0.17%). Similarly, the demographic groups most similar to Immigrants from Jordan are Immigrants from Argentina (12.8%, a difference of 0.010%), Immigrants from Vietnam (12.8%, a difference of 0.050%), Immigrants from Western Europe (12.8%, a difference of 0.060%), Immigrants from Switzerland (12.9%, a difference of 0.22%), and Immigrants from Brazil (12.8%, a difference of 0.24%).
| Demographics | Rating | Rank | Female Poverty |
| Puget Sound Salish | 91.5 /100 | #115 | Exceptional 12.7% |
| Immigrants | Russia | 91.2 /100 | #116 | Exceptional 12.7% |
| Immigrants | Southern Europe | 90.9 /100 | #117 | Exceptional 12.7% |
| Sri Lankans | 90.9 /100 | #118 | Exceptional 12.7% |
| Albanians | 90.8 /100 | #119 | Exceptional 12.7% |
| New Zealanders | 90.6 /100 | #120 | Exceptional 12.7% |
| Immigrants | Hungary | 90.3 /100 | #121 | Exceptional 12.7% |
| French Canadians | 90.2 /100 | #122 | Exceptional 12.7% |
| Immigrants | South Eastern Asia | 89.9 /100 | #123 | Excellent 12.7% |
| Immigrants | Norway | 89.3 /100 | #124 | Excellent 12.8% |
| Argentineans | 89.1 /100 | #125 | Excellent 12.8% |
| Immigrants | Ukraine | 88.8 /100 | #126 | Excellent 12.8% |
| South Africans | 88.4 /100 | #127 | Excellent 12.8% |
| Immigrants | Belarus | 88.2 /100 | #128 | Excellent 12.8% |
| Immigrants | Brazil | 87.9 /100 | #129 | Excellent 12.8% |
| Immigrants | Vietnam | 87.1 /100 | #130 | Excellent 12.8% |
| Immigrants | Argentina | 87.0 /100 | #131 | Excellent 12.8% |
| Immigrants | Jordan | 86.9 /100 | #132 | Excellent 12.8% |
| Immigrants | Western Europe | 86.6 /100 | #133 | Excellent 12.8% |
| Immigrants | Switzerland | 85.8 /100 | #134 | Excellent 12.9% |
| French | 85.6 /100 | #135 | Excellent 12.9% |