Yakama vs Immigrants from Jordan Female Poverty
COMPARE
Yakama
Immigrants from Jordan
Female Poverty
Female Poverty Comparison
Yakama
Immigrants from Jordan
18.0%
FEMALE POVERTY
0.0/ 100
METRIC RATING
327th/ 347
METRIC RANK
12.8%
FEMALE POVERTY
86.9/ 100
METRIC RATING
132nd/ 347
METRIC RANK
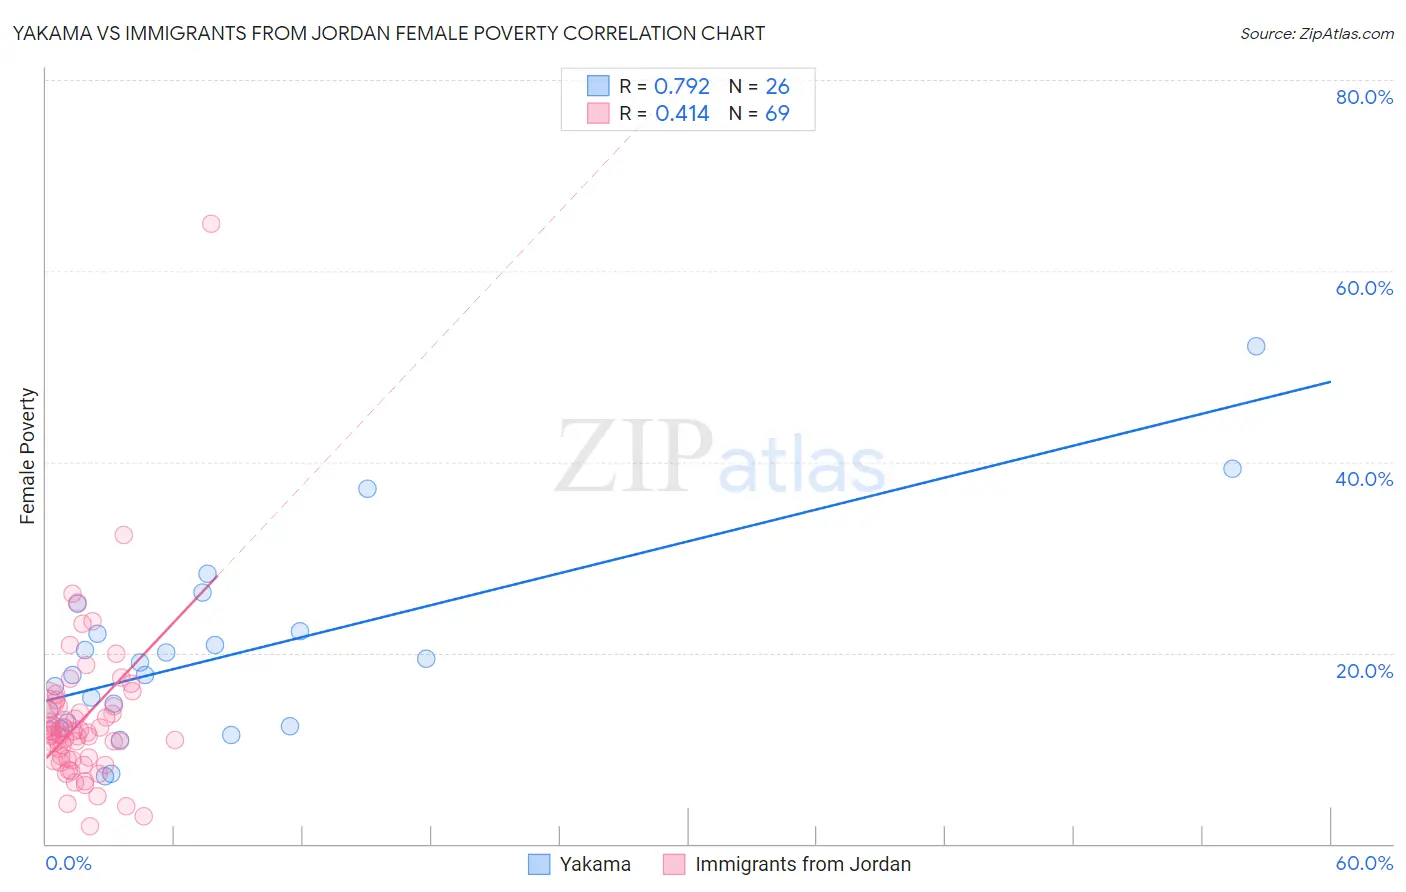
Yakama vs Immigrants from Jordan Female Poverty Correlation Chart
The statistical analysis conducted on geographies consisting of 19,917,707 people shows a strong positive correlation between the proportion of Yakama and poverty level among females in the United States with a correlation coefficient (R) of 0.792 and weighted average of 18.0%. Similarly, the statistical analysis conducted on geographies consisting of 181,244,945 people shows a moderate positive correlation between the proportion of Immigrants from Jordan and poverty level among females in the United States with a correlation coefficient (R) of 0.414 and weighted average of 12.8%, a difference of 40.6%.
Female Poverty Correlation Summary
| Measurement | Yakama | Immigrants from Jordan |
| Minimum | 7.1% | 1.8% |
| Maximum | 52.1% | 64.9% |
| Range | 44.9% | 63.1% |
| Mean | 20.1% | 13.0% |
| Median | 18.4% | 11.7% |
| Interquartile 25% (IQ1) | 12.8% | 8.8% |
| Interquartile 75% (IQ3) | 22.2% | 14.5% |
| Interquartile Range (IQR) | 9.5% | 5.7% |
| Standard Deviation (Sample) | 10.2% | 8.4% |
| Standard Deviation (Population) | 10.0% | 8.3% |
Similar Demographics by Female Poverty
Demographics Similar to Yakama by Female Poverty
In terms of female poverty, the demographic groups most similar to Yakama are Central American Indian (18.0%, a difference of 0.10%), Colville (17.8%, a difference of 1.6%), Immigrants from Honduras (17.7%, a difference of 1.8%), Paiute (17.7%, a difference of 2.0%), and Menominee (17.6%, a difference of 2.6%).
| Demographics | Rating | Rank | Female Poverty |
| Immigrants | Dominica | 0.0 /100 | #320 | Tragic 17.5% |
| Arapaho | 0.0 /100 | #321 | Tragic 17.5% |
| Menominee | 0.0 /100 | #322 | Tragic 17.6% |
| Paiute | 0.0 /100 | #323 | Tragic 17.7% |
| Immigrants | Honduras | 0.0 /100 | #324 | Tragic 17.7% |
| Colville | 0.0 /100 | #325 | Tragic 17.8% |
| Central American Indians | 0.0 /100 | #326 | Tragic 18.0% |
| Yakama | 0.0 /100 | #327 | Tragic 18.0% |
| Blacks/African Americans | 0.0 /100 | #328 | Tragic 18.6% |
| Kiowa | 0.0 /100 | #329 | Tragic 18.6% |
| Dominicans | 0.0 /100 | #330 | Tragic 19.1% |
| Natives/Alaskans | 0.0 /100 | #331 | Tragic 19.2% |
| Apache | 0.0 /100 | #332 | Tragic 19.2% |
| Immigrants | Dominican Republic | 0.0 /100 | #333 | Tragic 19.3% |
| Houma | 0.0 /100 | #334 | Tragic 20.0% |
Demographics Similar to Immigrants from Jordan by Female Poverty
In terms of female poverty, the demographic groups most similar to Immigrants from Jordan are Immigrants from Argentina (12.8%, a difference of 0.010%), Immigrants from Vietnam (12.8%, a difference of 0.050%), Immigrants from Western Europe (12.8%, a difference of 0.060%), Immigrants from Switzerland (12.9%, a difference of 0.22%), and Immigrants from Brazil (12.8%, a difference of 0.24%).
| Demographics | Rating | Rank | Female Poverty |
| Argentineans | 89.1 /100 | #125 | Excellent 12.8% |
| Immigrants | Ukraine | 88.8 /100 | #126 | Excellent 12.8% |
| South Africans | 88.4 /100 | #127 | Excellent 12.8% |
| Immigrants | Belarus | 88.2 /100 | #128 | Excellent 12.8% |
| Immigrants | Brazil | 87.9 /100 | #129 | Excellent 12.8% |
| Immigrants | Vietnam | 87.1 /100 | #130 | Excellent 12.8% |
| Immigrants | Argentina | 87.0 /100 | #131 | Excellent 12.8% |
| Immigrants | Jordan | 86.9 /100 | #132 | Excellent 12.8% |
| Immigrants | Western Europe | 86.6 /100 | #133 | Excellent 12.8% |
| Immigrants | Switzerland | 85.8 /100 | #134 | Excellent 12.9% |
| French | 85.6 /100 | #135 | Excellent 12.9% |
| Peruvians | 85.2 /100 | #136 | Excellent 12.9% |
| Chileans | 84.7 /100 | #137 | Excellent 12.9% |
| Immigrants | France | 83.6 /100 | #138 | Excellent 12.9% |
| Basques | 83.1 /100 | #139 | Excellent 12.9% |