Spanish American Indian vs Belgian Female Poverty
COMPARE
Spanish American Indian
Belgian
Female Poverty
Female Poverty Comparison
Spanish American Indians
Belgians
15.3%
FEMALE POVERTY
0.3/ 100
METRIC RATING
245th/ 347
METRIC RANK
12.4%
FEMALE POVERTY
95.8/ 100
METRIC RATING
91st/ 347
METRIC RANK
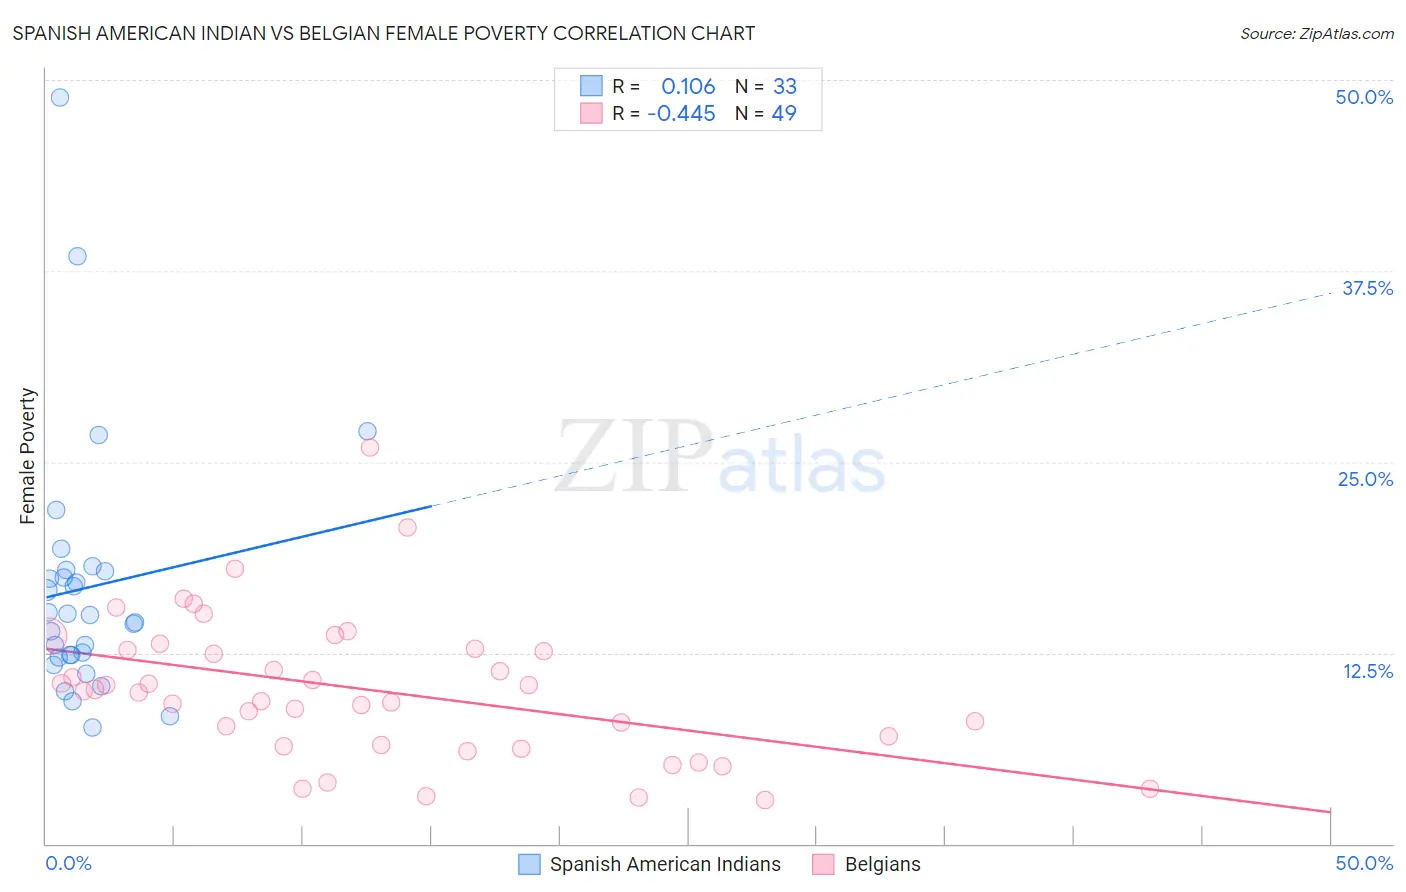
Spanish American Indian vs Belgian Female Poverty Correlation Chart
The statistical analysis conducted on geographies consisting of 73,136,112 people shows a poor positive correlation between the proportion of Spanish American Indians and poverty level among females in the United States with a correlation coefficient (R) of 0.106 and weighted average of 15.3%. Similarly, the statistical analysis conducted on geographies consisting of 355,775,724 people shows a moderate negative correlation between the proportion of Belgians and poverty level among females in the United States with a correlation coefficient (R) of -0.445 and weighted average of 12.4%, a difference of 23.0%.
Female Poverty Correlation Summary
| Measurement | Spanish American Indian | Belgian |
| Minimum | 7.6% | 2.9% |
| Maximum | 48.9% | 25.9% |
| Range | 41.2% | 23.0% |
| Mean | 16.8% | 10.1% |
| Median | 15.0% | 10.0% |
| Interquartile 25% (IQ1) | 12.3% | 6.4% |
| Interquartile 75% (IQ3) | 17.9% | 12.8% |
| Interquartile Range (IQR) | 5.6% | 6.3% |
| Standard Deviation (Sample) | 8.3% | 4.7% |
| Standard Deviation (Population) | 8.2% | 4.6% |
Similar Demographics by Female Poverty
Demographics Similar to Spanish American Indians by Female Poverty
In terms of female poverty, the demographic groups most similar to Spanish American Indians are Cuban (15.3%, a difference of 0.050%), Potawatomi (15.3%, a difference of 0.060%), Immigrants from Ghana (15.3%, a difference of 0.060%), Ecuadorian (15.3%, a difference of 0.090%), and Nicaraguan (15.3%, a difference of 0.15%).
| Demographics | Rating | Rank | Female Poverty |
| Immigrants | Armenia | 0.6 /100 | #238 | Tragic 15.1% |
| Immigrants | Middle Africa | 0.5 /100 | #239 | Tragic 15.2% |
| Sudanese | 0.5 /100 | #240 | Tragic 15.2% |
| Immigrants | Sudan | 0.4 /100 | #241 | Tragic 15.2% |
| Nepalese | 0.4 /100 | #242 | Tragic 15.2% |
| Nicaraguans | 0.3 /100 | #243 | Tragic 15.3% |
| Ecuadorians | 0.3 /100 | #244 | Tragic 15.3% |
| Spanish American Indians | 0.3 /100 | #245 | Tragic 15.3% |
| Cubans | 0.3 /100 | #246 | Tragic 15.3% |
| Potawatomi | 0.3 /100 | #247 | Tragic 15.3% |
| Immigrants | Ghana | 0.3 /100 | #248 | Tragic 15.3% |
| Salvadorans | 0.3 /100 | #249 | Tragic 15.3% |
| Immigrants | Western Africa | 0.3 /100 | #250 | Tragic 15.3% |
| Immigrants | Trinidad and Tobago | 0.3 /100 | #251 | Tragic 15.4% |
| Immigrants | Burma/Myanmar | 0.3 /100 | #252 | Tragic 15.4% |
Demographics Similar to Belgians by Female Poverty
In terms of female poverty, the demographic groups most similar to Belgians are Immigrants from Denmark (12.4%, a difference of 0.010%), Czechoslovakian (12.4%, a difference of 0.010%), Immigrants from Egypt (12.5%, a difference of 0.18%), Immigrants from Indonesia (12.5%, a difference of 0.21%), and English (12.4%, a difference of 0.23%).
| Demographics | Rating | Rank | Female Poverty |
| Northern Europeans | 96.6 /100 | #84 | Exceptional 12.4% |
| Irish | 96.5 /100 | #85 | Exceptional 12.4% |
| Dutch | 96.5 /100 | #86 | Exceptional 12.4% |
| Okinawans | 96.4 /100 | #87 | Exceptional 12.4% |
| Finns | 96.4 /100 | #88 | Exceptional 12.4% |
| English | 96.1 /100 | #89 | Exceptional 12.4% |
| Immigrants | Denmark | 95.8 /100 | #90 | Exceptional 12.4% |
| Belgians | 95.8 /100 | #91 | Exceptional 12.4% |
| Czechoslovakians | 95.7 /100 | #92 | Exceptional 12.4% |
| Immigrants | Egypt | 95.5 /100 | #93 | Exceptional 12.5% |
| Immigrants | Indonesia | 95.4 /100 | #94 | Exceptional 12.5% |
| Immigrants | South Africa | 95.4 /100 | #95 | Exceptional 12.5% |
| British | 95.2 /100 | #96 | Exceptional 12.5% |
| Australians | 95.2 /100 | #97 | Exceptional 12.5% |
| Native Hawaiians | 95.1 /100 | #98 | Exceptional 12.5% |