Spaniard vs Immigrants from Dominican Republic Family Poverty
COMPARE
Spaniard
Immigrants from Dominican Republic
Family Poverty
Family Poverty Comparison
Spaniards
Immigrants from Dominican Republic
9.4%
FAMILY POVERTY
22.8/ 100
METRIC RATING
199th/ 347
METRIC RANK
14.4%
FAMILY POVERTY
0.0/ 100
METRIC RATING
333rd/ 347
METRIC RANK
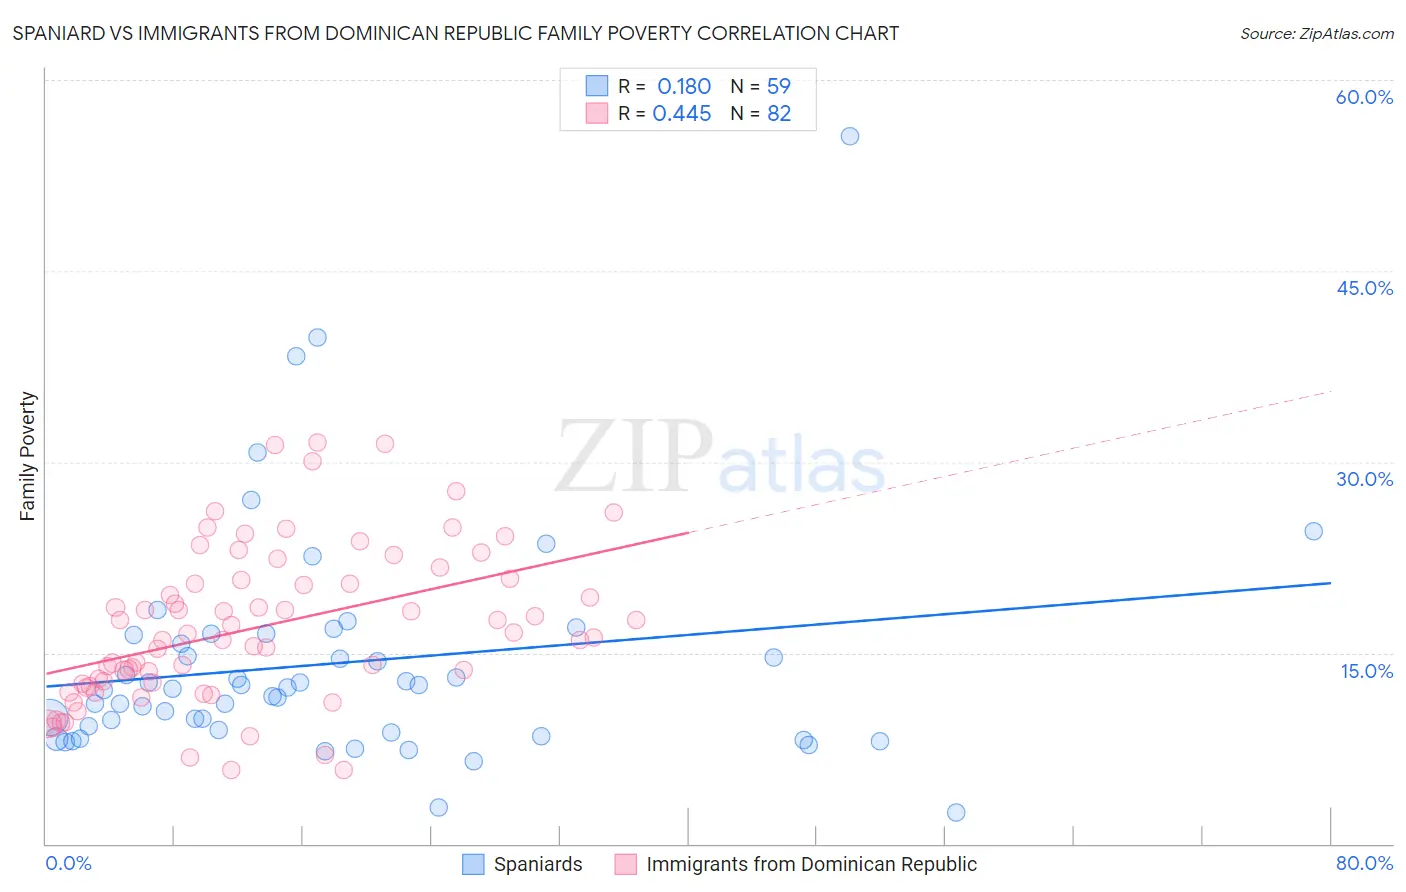
Spaniard vs Immigrants from Dominican Republic Family Poverty Correlation Chart
The statistical analysis conducted on geographies consisting of 441,991,510 people shows a poor positive correlation between the proportion of Spaniards and poverty level among families in the United States with a correlation coefficient (R) of 0.180 and weighted average of 9.4%. Similarly, the statistical analysis conducted on geographies consisting of 274,499,505 people shows a moderate positive correlation between the proportion of Immigrants from Dominican Republic and poverty level among families in the United States with a correlation coefficient (R) of 0.445 and weighted average of 14.4%, a difference of 54.1%.
Family Poverty Correlation Summary
| Measurement | Spaniard | Immigrants from Dominican Republic |
| Minimum | 2.5% | 5.8% |
| Maximum | 55.6% | 31.5% |
| Range | 53.1% | 25.8% |
| Mean | 14.2% | 17.0% |
| Median | 12.2% | 16.3% |
| Interquartile 25% (IQ1) | 8.7% | 12.5% |
| Interquartile 75% (IQ3) | 16.4% | 20.7% |
| Interquartile Range (IQR) | 7.7% | 8.2% |
| Standard Deviation (Sample) | 9.0% | 6.1% |
| Standard Deviation (Population) | 9.0% | 6.0% |
Similar Demographics by Family Poverty
Demographics Similar to Spaniards by Family Poverty
In terms of family poverty, the demographic groups most similar to Spaniards are Immigrants from Costa Rica (9.4%, a difference of 0.19%), Iraqi (9.3%, a difference of 0.25%), Immigrants from Colombia (9.3%, a difference of 0.28%), Immigrants from Portugal (9.4%, a difference of 0.42%), and Immigrants from Venezuela (9.3%, a difference of 0.57%).
| Demographics | Rating | Rank | Family Poverty |
| Spanish | 28.7 /100 | #192 | Fair 9.3% |
| Immigrants | Western Asia | 28.2 /100 | #193 | Fair 9.3% |
| South Americans | 28.1 /100 | #194 | Fair 9.3% |
| Venezuelans | 27.4 /100 | #195 | Fair 9.3% |
| Immigrants | Venezuela | 26.1 /100 | #196 | Fair 9.3% |
| Immigrants | Colombia | 24.4 /100 | #197 | Fair 9.3% |
| Iraqis | 24.2 /100 | #198 | Fair 9.3% |
| Spaniards | 22.8 /100 | #199 | Fair 9.4% |
| Immigrants | Costa Rica | 21.7 /100 | #200 | Fair 9.4% |
| Immigrants | Portugal | 20.5 /100 | #201 | Fair 9.4% |
| Immigrants | Sierra Leone | 19.6 /100 | #202 | Poor 9.4% |
| German Russians | 19.4 /100 | #203 | Poor 9.4% |
| Immigrants | Lebanon | 18.9 /100 | #204 | Poor 9.4% |
| Aleuts | 18.0 /100 | #205 | Poor 9.5% |
| Immigrants | South America | 18.0 /100 | #206 | Poor 9.5% |
Demographics Similar to Immigrants from Dominican Republic by Family Poverty
In terms of family poverty, the demographic groups most similar to Immigrants from Dominican Republic are Dominican (14.3%, a difference of 0.63%), Cheyenne (14.3%, a difference of 1.1%), Native/Alaskan (14.3%, a difference of 1.2%), Houma (14.6%, a difference of 1.3%), and Apache (14.7%, a difference of 2.1%).
| Demographics | Rating | Rank | Family Poverty |
| Colville | 0.0 /100 | #326 | Tragic 13.0% |
| Yakama | 0.0 /100 | #327 | Tragic 13.1% |
| Central American Indians | 0.0 /100 | #328 | Tragic 13.3% |
| Blacks/African Americans | 0.0 /100 | #329 | Tragic 13.3% |
| Natives/Alaskans | 0.0 /100 | #330 | Tragic 14.3% |
| Cheyenne | 0.0 /100 | #331 | Tragic 14.3% |
| Dominicans | 0.0 /100 | #332 | Tragic 14.3% |
| Immigrants | Dominican Republic | 0.0 /100 | #333 | Tragic 14.4% |
| Houma | 0.0 /100 | #334 | Tragic 14.6% |
| Apache | 0.0 /100 | #335 | Tragic 14.7% |
| Sioux | 0.0 /100 | #336 | Tragic 15.9% |
| Hopi | 0.0 /100 | #337 | Tragic 15.9% |
| Crow | 0.0 /100 | #338 | Tragic 16.1% |
| Yuman | 0.0 /100 | #339 | Tragic 16.6% |
| Pueblo | 0.0 /100 | #340 | Tragic 17.0% |