Spaniard vs Costa Rican Family Poverty
COMPARE
Spaniard
Costa Rican
Family Poverty
Family Poverty Comparison
Spaniards
Costa Ricans
9.4%
FAMILY POVERTY
22.8/ 100
METRIC RATING
199th/ 347
METRIC RANK
9.0%
FAMILY POVERTY
49.3/ 100
METRIC RATING
175th/ 347
METRIC RANK
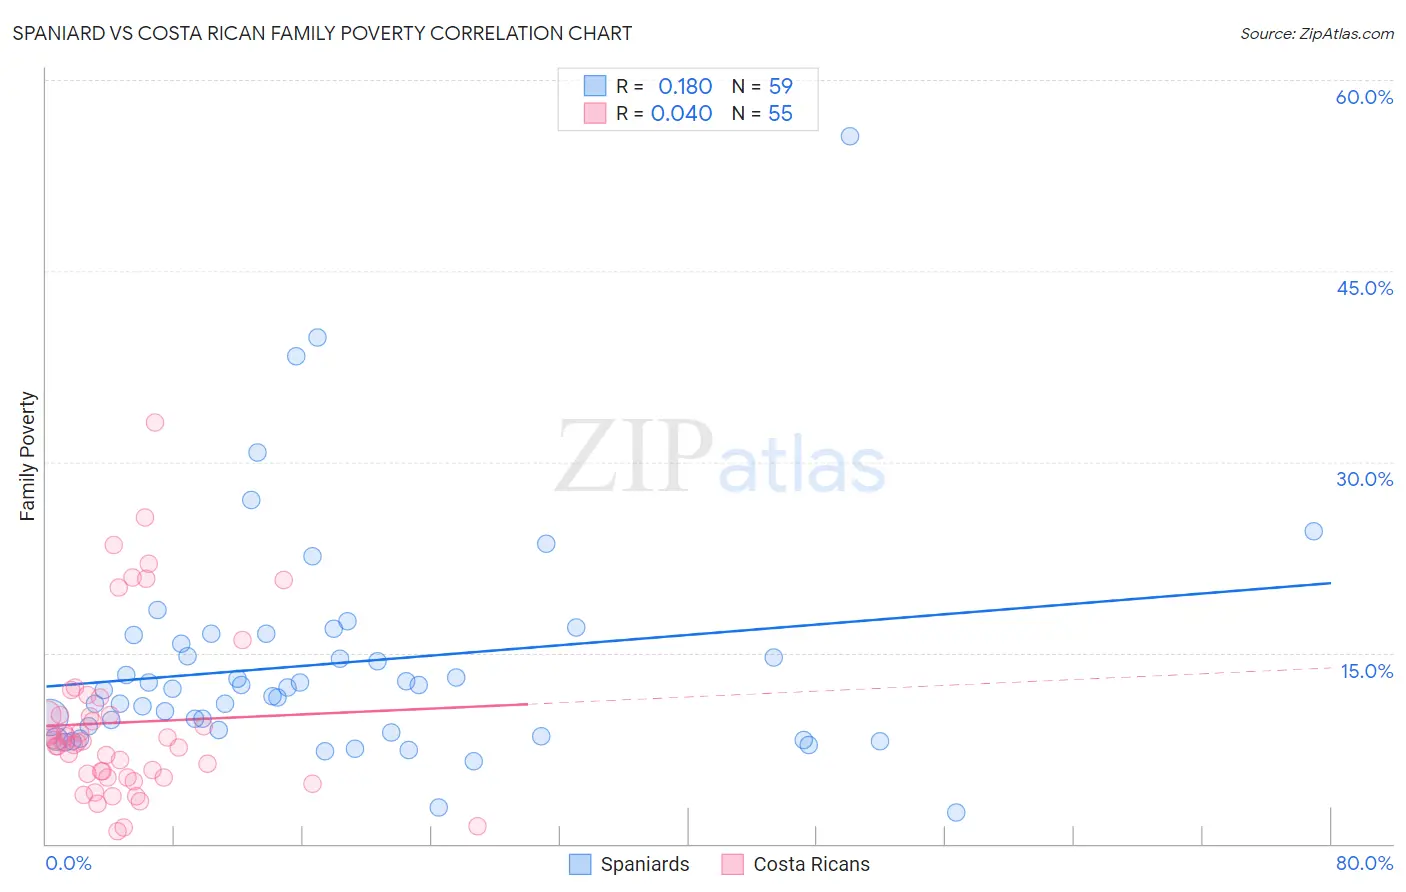
Spaniard vs Costa Rican Family Poverty Correlation Chart
The statistical analysis conducted on geographies consisting of 441,991,510 people shows a poor positive correlation between the proportion of Spaniards and poverty level among families in the United States with a correlation coefficient (R) of 0.180 and weighted average of 9.4%. Similarly, the statistical analysis conducted on geographies consisting of 253,260,366 people shows no correlation between the proportion of Costa Ricans and poverty level among families in the United States with a correlation coefficient (R) of 0.040 and weighted average of 9.0%, a difference of 3.9%.
Family Poverty Correlation Summary
| Measurement | Spaniard | Costa Rican |
| Minimum | 2.5% | 0.94% |
| Maximum | 55.6% | 33.1% |
| Range | 53.1% | 32.2% |
| Mean | 14.2% | 9.5% |
| Median | 12.2% | 8.0% |
| Interquartile 25% (IQ1) | 8.7% | 5.2% |
| Interquartile 75% (IQ3) | 16.4% | 10.1% |
| Interquartile Range (IQR) | 7.7% | 4.9% |
| Standard Deviation (Sample) | 9.0% | 6.6% |
| Standard Deviation (Population) | 9.0% | 6.6% |
Similar Demographics by Family Poverty
Demographics Similar to Spaniards by Family Poverty
In terms of family poverty, the demographic groups most similar to Spaniards are Immigrants from Costa Rica (9.4%, a difference of 0.19%), Iraqi (9.3%, a difference of 0.25%), Immigrants from Colombia (9.3%, a difference of 0.28%), Immigrants from Portugal (9.4%, a difference of 0.42%), and Immigrants from Venezuela (9.3%, a difference of 0.57%).
| Demographics | Rating | Rank | Family Poverty |
| Spanish | 28.7 /100 | #192 | Fair 9.3% |
| Immigrants | Western Asia | 28.2 /100 | #193 | Fair 9.3% |
| South Americans | 28.1 /100 | #194 | Fair 9.3% |
| Venezuelans | 27.4 /100 | #195 | Fair 9.3% |
| Immigrants | Venezuela | 26.1 /100 | #196 | Fair 9.3% |
| Immigrants | Colombia | 24.4 /100 | #197 | Fair 9.3% |
| Iraqis | 24.2 /100 | #198 | Fair 9.3% |
| Spaniards | 22.8 /100 | #199 | Fair 9.4% |
| Immigrants | Costa Rica | 21.7 /100 | #200 | Fair 9.4% |
| Immigrants | Portugal | 20.5 /100 | #201 | Fair 9.4% |
| Immigrants | Sierra Leone | 19.6 /100 | #202 | Poor 9.4% |
| German Russians | 19.4 /100 | #203 | Poor 9.4% |
| Immigrants | Lebanon | 18.9 /100 | #204 | Poor 9.4% |
| Aleuts | 18.0 /100 | #205 | Poor 9.5% |
| Immigrants | South America | 18.0 /100 | #206 | Poor 9.5% |
Demographics Similar to Costa Ricans by Family Poverty
In terms of family poverty, the demographic groups most similar to Costa Ricans are Immigrants from Albania (9.0%, a difference of 0.090%), Immigrants from Syria (9.0%, a difference of 0.24%), Hawaiian (9.0%, a difference of 0.27%), Immigrants from Cameroon (9.0%, a difference of 0.28%), and Immigrants from Iraq (9.1%, a difference of 0.65%).
| Demographics | Rating | Rank | Family Poverty |
| Israelis | 62.1 /100 | #168 | Good 8.9% |
| Immigrants | Chile | 59.6 /100 | #169 | Average 8.9% |
| Kenyans | 58.2 /100 | #170 | Average 8.9% |
| Lebanese | 57.6 /100 | #171 | Average 8.9% |
| Immigrants | Peru | 57.5 /100 | #172 | Average 8.9% |
| Immigrants | Fiji | 56.4 /100 | #173 | Average 8.9% |
| Immigrants | Albania | 50.0 /100 | #174 | Average 9.0% |
| Costa Ricans | 49.3 /100 | #175 | Average 9.0% |
| Immigrants | Syria | 47.5 /100 | #176 | Average 9.0% |
| Hawaiians | 47.2 /100 | #177 | Average 9.0% |
| Immigrants | Cameroon | 47.1 /100 | #178 | Average 9.0% |
| Immigrants | Iraq | 44.4 /100 | #179 | Average 9.1% |
| Immigrants | Uganda | 43.4 /100 | #180 | Average 9.1% |
| Hmong | 40.2 /100 | #181 | Average 9.1% |
| Immigrants | Morocco | 40.2 /100 | #182 | Average 9.1% |