Chippewa vs Immigrants from Dominican Republic Family Poverty
COMPARE
Chippewa
Immigrants from Dominican Republic
Family Poverty
Family Poverty Comparison
Chippewa
Immigrants from Dominican Republic
11.2%
FAMILY POVERTY
0.1/ 100
METRIC RATING
277th/ 347
METRIC RANK
14.4%
FAMILY POVERTY
0.0/ 100
METRIC RATING
333rd/ 347
METRIC RANK
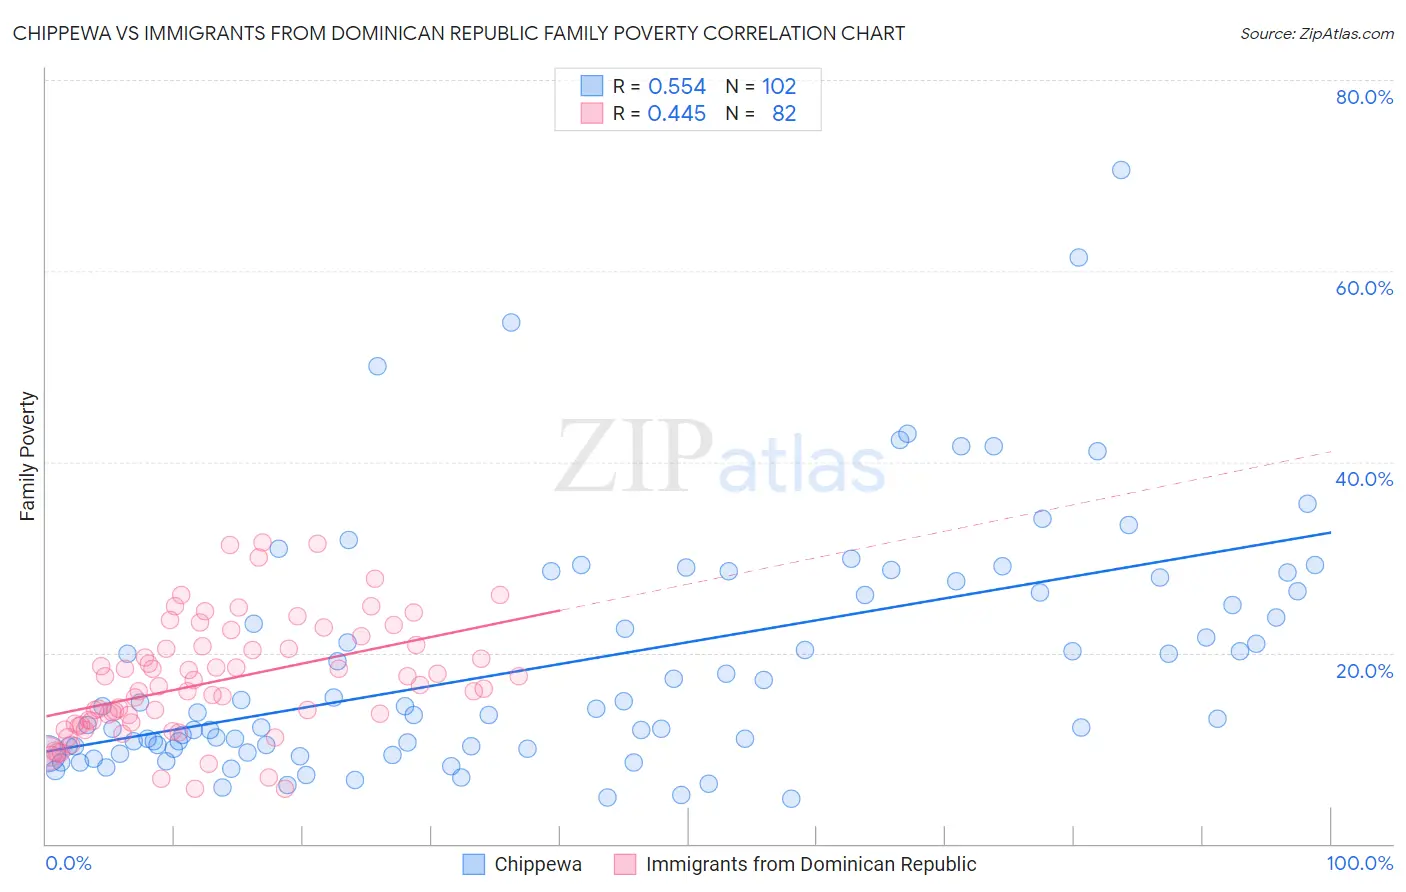
Chippewa vs Immigrants from Dominican Republic Family Poverty Correlation Chart
The statistical analysis conducted on geographies consisting of 214,735,331 people shows a substantial positive correlation between the proportion of Chippewa and poverty level among families in the United States with a correlation coefficient (R) of 0.554 and weighted average of 11.2%. Similarly, the statistical analysis conducted on geographies consisting of 274,499,505 people shows a moderate positive correlation between the proportion of Immigrants from Dominican Republic and poverty level among families in the United States with a correlation coefficient (R) of 0.445 and weighted average of 14.4%, a difference of 28.5%.
Family Poverty Correlation Summary
| Measurement | Chippewa | Immigrants from Dominican Republic |
| Minimum | 4.7% | 5.8% |
| Maximum | 70.6% | 31.5% |
| Range | 65.9% | 25.8% |
| Mean | 19.0% | 17.0% |
| Median | 14.0% | 16.3% |
| Interquartile 25% (IQ1) | 10.2% | 12.5% |
| Interquartile 75% (IQ3) | 26.5% | 20.7% |
| Interquartile Range (IQR) | 16.3% | 8.2% |
| Standard Deviation (Sample) | 12.8% | 6.1% |
| Standard Deviation (Population) | 12.7% | 6.0% |
Similar Demographics by Family Poverty
Demographics Similar to Chippewa by Family Poverty
In terms of family poverty, the demographic groups most similar to Chippewa are Guyanese (11.2%, a difference of 0.030%), Immigrants from Guyana (11.2%, a difference of 0.090%), Central American (11.2%, a difference of 0.11%), Spanish American (11.2%, a difference of 0.16%), and Blackfeet (11.3%, a difference of 0.16%).
| Demographics | Rating | Rank | Family Poverty |
| Immigrants | Nicaragua | 0.1 /100 | #270 | Tragic 11.1% |
| Immigrants | Bahamas | 0.1 /100 | #271 | Tragic 11.1% |
| Immigrants | Jamaica | 0.1 /100 | #272 | Tragic 11.2% |
| Somalis | 0.1 /100 | #273 | Tragic 11.2% |
| Spanish Americans | 0.1 /100 | #274 | Tragic 11.2% |
| Central Americans | 0.1 /100 | #275 | Tragic 11.2% |
| Immigrants | Guyana | 0.1 /100 | #276 | Tragic 11.2% |
| Chippewa | 0.1 /100 | #277 | Tragic 11.2% |
| Guyanese | 0.1 /100 | #278 | Tragic 11.2% |
| Blackfeet | 0.0 /100 | #279 | Tragic 11.3% |
| Belizeans | 0.0 /100 | #280 | Tragic 11.3% |
| Immigrants | West Indies | 0.0 /100 | #281 | Tragic 11.3% |
| Immigrants | Cuba | 0.0 /100 | #282 | Tragic 11.3% |
| Indonesians | 0.0 /100 | #283 | Tragic 11.3% |
| Yaqui | 0.0 /100 | #284 | Tragic 11.3% |
Demographics Similar to Immigrants from Dominican Republic by Family Poverty
In terms of family poverty, the demographic groups most similar to Immigrants from Dominican Republic are Dominican (14.3%, a difference of 0.63%), Cheyenne (14.3%, a difference of 1.1%), Native/Alaskan (14.3%, a difference of 1.2%), Houma (14.6%, a difference of 1.3%), and Apache (14.7%, a difference of 2.1%).
| Demographics | Rating | Rank | Family Poverty |
| Colville | 0.0 /100 | #326 | Tragic 13.0% |
| Yakama | 0.0 /100 | #327 | Tragic 13.1% |
| Central American Indians | 0.0 /100 | #328 | Tragic 13.3% |
| Blacks/African Americans | 0.0 /100 | #329 | Tragic 13.3% |
| Natives/Alaskans | 0.0 /100 | #330 | Tragic 14.3% |
| Cheyenne | 0.0 /100 | #331 | Tragic 14.3% |
| Dominicans | 0.0 /100 | #332 | Tragic 14.3% |
| Immigrants | Dominican Republic | 0.0 /100 | #333 | Tragic 14.4% |
| Houma | 0.0 /100 | #334 | Tragic 14.6% |
| Apache | 0.0 /100 | #335 | Tragic 14.7% |
| Sioux | 0.0 /100 | #336 | Tragic 15.9% |
| Hopi | 0.0 /100 | #337 | Tragic 15.9% |
| Crow | 0.0 /100 | #338 | Tragic 16.1% |
| Yuman | 0.0 /100 | #339 | Tragic 16.6% |
| Pueblo | 0.0 /100 | #340 | Tragic 17.0% |