Spaniard vs Immigrants from South Africa Family Poverty
COMPARE
Spaniard
Immigrants from South Africa
Family Poverty
Family Poverty Comparison
Spaniards
Immigrants from South Africa
9.4%
FAMILY POVERTY
22.8/ 100
METRIC RATING
199th/ 347
METRIC RANK
8.1%
FAMILY POVERTY
95.9/ 100
METRIC RATING
98th/ 347
METRIC RANK
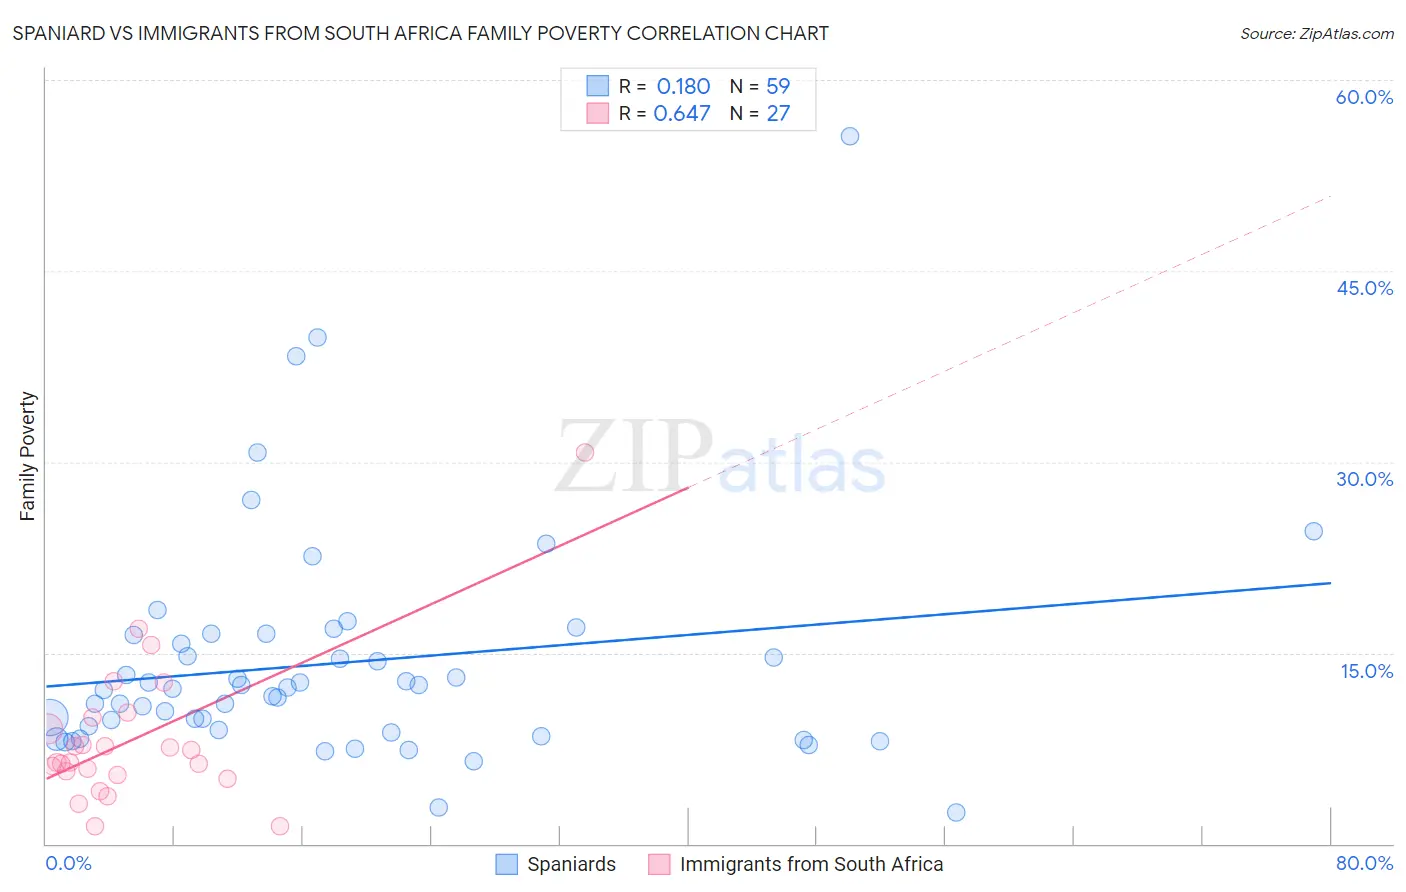
Spaniard vs Immigrants from South Africa Family Poverty Correlation Chart
The statistical analysis conducted on geographies consisting of 441,991,510 people shows a poor positive correlation between the proportion of Spaniards and poverty level among families in the United States with a correlation coefficient (R) of 0.180 and weighted average of 9.4%. Similarly, the statistical analysis conducted on geographies consisting of 232,909,353 people shows a significant positive correlation between the proportion of Immigrants from South Africa and poverty level among families in the United States with a correlation coefficient (R) of 0.647 and weighted average of 8.1%, a difference of 16.0%.
Family Poverty Correlation Summary
| Measurement | Spaniard | Immigrants from South Africa |
| Minimum | 2.5% | 1.3% |
| Maximum | 55.6% | 30.8% |
| Range | 53.1% | 29.4% |
| Mean | 14.2% | 8.3% |
| Median | 12.2% | 6.4% |
| Interquartile 25% (IQ1) | 8.7% | 5.4% |
| Interquartile 75% (IQ3) | 16.4% | 9.9% |
| Interquartile Range (IQR) | 7.7% | 4.5% |
| Standard Deviation (Sample) | 9.0% | 5.9% |
| Standard Deviation (Population) | 9.0% | 5.8% |
Similar Demographics by Family Poverty
Demographics Similar to Spaniards by Family Poverty
In terms of family poverty, the demographic groups most similar to Spaniards are Immigrants from Costa Rica (9.4%, a difference of 0.19%), Iraqi (9.3%, a difference of 0.25%), Immigrants from Colombia (9.3%, a difference of 0.28%), Immigrants from Portugal (9.4%, a difference of 0.42%), and Immigrants from Venezuela (9.3%, a difference of 0.57%).
| Demographics | Rating | Rank | Family Poverty |
| Spanish | 28.7 /100 | #192 | Fair 9.3% |
| Immigrants | Western Asia | 28.2 /100 | #193 | Fair 9.3% |
| South Americans | 28.1 /100 | #194 | Fair 9.3% |
| Venezuelans | 27.4 /100 | #195 | Fair 9.3% |
| Immigrants | Venezuela | 26.1 /100 | #196 | Fair 9.3% |
| Immigrants | Colombia | 24.4 /100 | #197 | Fair 9.3% |
| Iraqis | 24.2 /100 | #198 | Fair 9.3% |
| Spaniards | 22.8 /100 | #199 | Fair 9.4% |
| Immigrants | Costa Rica | 21.7 /100 | #200 | Fair 9.4% |
| Immigrants | Portugal | 20.5 /100 | #201 | Fair 9.4% |
| Immigrants | Sierra Leone | 19.6 /100 | #202 | Poor 9.4% |
| German Russians | 19.4 /100 | #203 | Poor 9.4% |
| Immigrants | Lebanon | 18.9 /100 | #204 | Poor 9.4% |
| Aleuts | 18.0 /100 | #205 | Poor 9.5% |
| Immigrants | South America | 18.0 /100 | #206 | Poor 9.5% |
Demographics Similar to Immigrants from South Africa by Family Poverty
In terms of family poverty, the demographic groups most similar to Immigrants from South Africa are Welsh (8.1%, a difference of 0.070%), New Zealander (8.1%, a difference of 0.14%), Immigrants from Norway (8.1%, a difference of 0.17%), Immigrants from Indonesia (8.1%, a difference of 0.18%), and Immigrants from Switzerland (8.1%, a difference of 0.21%).
| Demographics | Rating | Rank | Family Poverty |
| Immigrants | Italy | 97.0 /100 | #91 | Exceptional 8.0% |
| Czechoslovakians | 96.8 /100 | #92 | Exceptional 8.0% |
| Tlingit-Haida | 96.7 /100 | #93 | Exceptional 8.0% |
| Immigrants | Pakistan | 96.6 /100 | #94 | Exceptional 8.0% |
| Immigrants | Philippines | 96.5 /100 | #95 | Exceptional 8.0% |
| Immigrants | Turkey | 96.5 /100 | #96 | Exceptional 8.0% |
| Immigrants | Switzerland | 96.1 /100 | #97 | Exceptional 8.1% |
| Immigrants | South Africa | 95.9 /100 | #98 | Exceptional 8.1% |
| Welsh | 95.8 /100 | #99 | Exceptional 8.1% |
| New Zealanders | 95.8 /100 | #100 | Exceptional 8.1% |
| Immigrants | Norway | 95.7 /100 | #101 | Exceptional 8.1% |
| Immigrants | Indonesia | 95.7 /100 | #102 | Exceptional 8.1% |
| Immigrants | Eastern Europe | 95.6 /100 | #103 | Exceptional 8.1% |
| Slavs | 95.6 /100 | #104 | Exceptional 8.1% |
| Laotians | 95.6 /100 | #105 | Exceptional 8.1% |