Immigrants from Yemen vs Immigrants from Dominican Republic Family Poverty
COMPARE
Immigrants from Yemen
Immigrants from Dominican Republic
Family Poverty
Family Poverty Comparison
Immigrants from Yemen
Immigrants from Dominican Republic
17.5%
FAMILY POVERTY
0.0/ 100
METRIC RATING
342nd/ 347
METRIC RANK
14.4%
FAMILY POVERTY
0.0/ 100
METRIC RATING
333rd/ 347
METRIC RANK
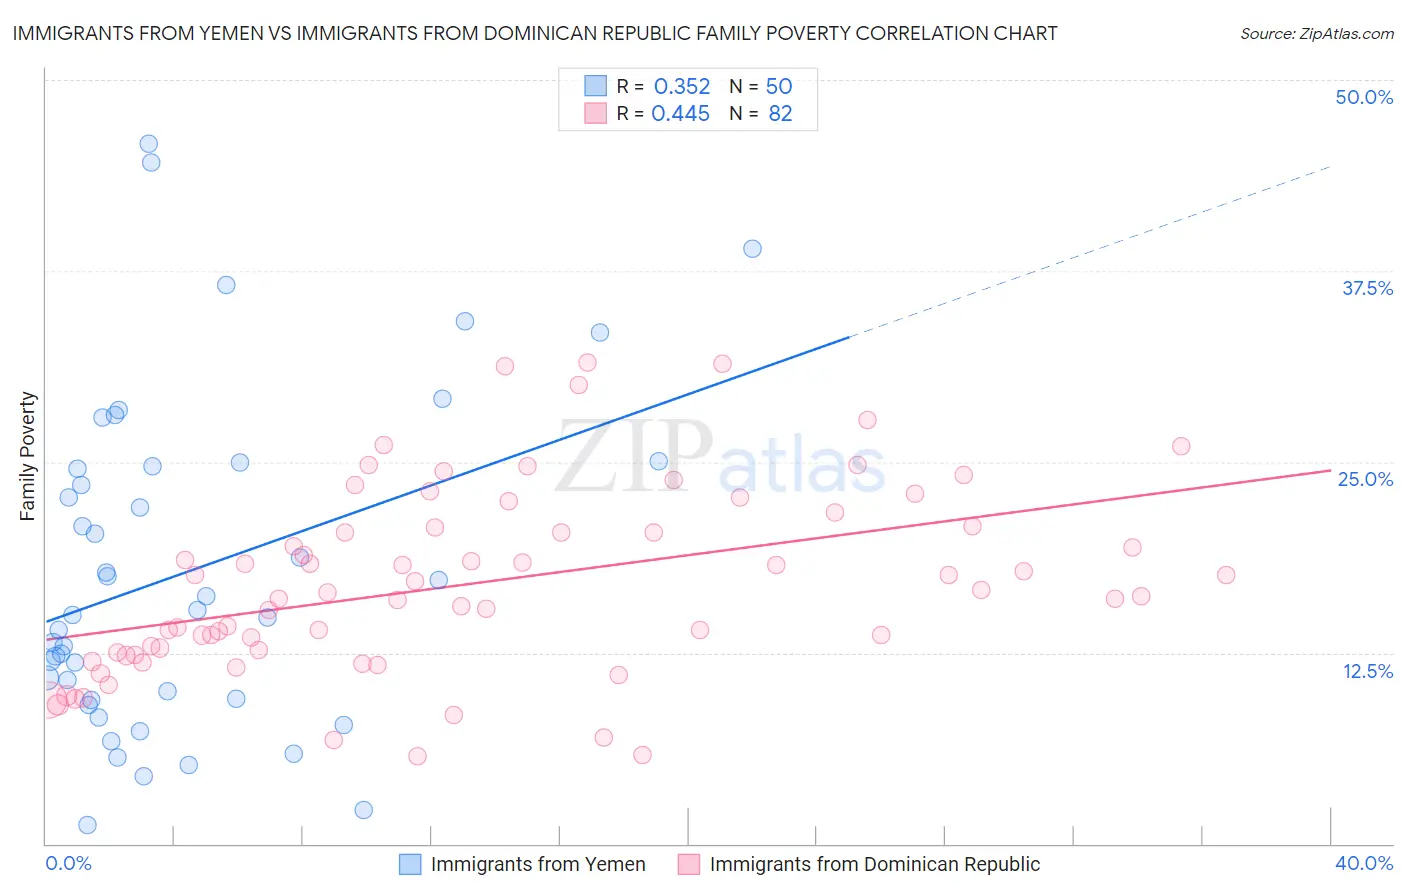
Immigrants from Yemen vs Immigrants from Dominican Republic Family Poverty Correlation Chart
The statistical analysis conducted on geographies consisting of 82,405,331 people shows a mild positive correlation between the proportion of Immigrants from Yemen and poverty level among families in the United States with a correlation coefficient (R) of 0.352 and weighted average of 17.5%. Similarly, the statistical analysis conducted on geographies consisting of 274,499,505 people shows a moderate positive correlation between the proportion of Immigrants from Dominican Republic and poverty level among families in the United States with a correlation coefficient (R) of 0.445 and weighted average of 14.4%, a difference of 21.0%.
Family Poverty Correlation Summary
| Measurement | Immigrants from Yemen | Immigrants from Dominican Republic |
| Minimum | 1.2% | 5.8% |
| Maximum | 45.8% | 31.5% |
| Range | 44.6% | 25.8% |
| Mean | 17.8% | 17.0% |
| Median | 15.2% | 16.3% |
| Interquartile 25% (IQ1) | 9.5% | 12.5% |
| Interquartile 75% (IQ3) | 24.7% | 20.7% |
| Interquartile Range (IQR) | 15.2% | 8.2% |
| Standard Deviation (Sample) | 10.8% | 6.1% |
| Standard Deviation (Population) | 10.7% | 6.0% |
Demographics Similar to Immigrants from Yemen and Immigrants from Dominican Republic by Family Poverty
In terms of family poverty, the demographic groups most similar to Immigrants from Yemen are Lumbee (17.0%, a difference of 2.8%), Pueblo (17.0%, a difference of 2.8%), Yuman (16.6%, a difference of 5.0%), Pima (18.4%, a difference of 5.1%), and Yup'ik (18.7%, a difference of 7.1%). Similarly, the demographic groups most similar to Immigrants from Dominican Republic are Dominican (14.3%, a difference of 0.63%), Cheyenne (14.3%, a difference of 1.1%), Native/Alaskan (14.3%, a difference of 1.2%), Houma (14.6%, a difference of 1.3%), and Apache (14.7%, a difference of 2.1%).
| Demographics | Rating | Rank | Family Poverty |
| Yakama | 0.0 /100 | #327 | Tragic 13.1% |
| Central American Indians | 0.0 /100 | #328 | Tragic 13.3% |
| Blacks/African Americans | 0.0 /100 | #329 | Tragic 13.3% |
| Natives/Alaskans | 0.0 /100 | #330 | Tragic 14.3% |
| Cheyenne | 0.0 /100 | #331 | Tragic 14.3% |
| Dominicans | 0.0 /100 | #332 | Tragic 14.3% |
| Immigrants | Dominican Republic | 0.0 /100 | #333 | Tragic 14.4% |
| Houma | 0.0 /100 | #334 | Tragic 14.6% |
| Apache | 0.0 /100 | #335 | Tragic 14.7% |
| Sioux | 0.0 /100 | #336 | Tragic 15.9% |
| Hopi | 0.0 /100 | #337 | Tragic 15.9% |
| Crow | 0.0 /100 | #338 | Tragic 16.1% |
| Yuman | 0.0 /100 | #339 | Tragic 16.6% |
| Pueblo | 0.0 /100 | #340 | Tragic 17.0% |
| Lumbee | 0.0 /100 | #341 | Tragic 17.0% |
| Immigrants | Yemen | 0.0 /100 | #342 | Tragic 17.5% |
| Pima | 0.0 /100 | #343 | Tragic 18.4% |
| Yup'ik | 0.0 /100 | #344 | Tragic 18.7% |
| Navajo | 0.0 /100 | #345 | Tragic 18.8% |
| Puerto Ricans | 0.0 /100 | #346 | Tragic 20.3% |
| Tohono O'odham | 0.0 /100 | #347 | Tragic 20.4% |