Cheyenne vs Seminole Single Female Poverty
COMPARE
Cheyenne
Seminole
Single Female Poverty
Single Female Poverty Comparison
Cheyenne
Seminole
30.4%
SINGLE FEMALE POVERTY
0.0/ 100
METRIC RATING
339th/ 347
METRIC RANK
26.8%
SINGLE FEMALE POVERTY
0.0/ 100
METRIC RATING
322nd/ 347
METRIC RANK
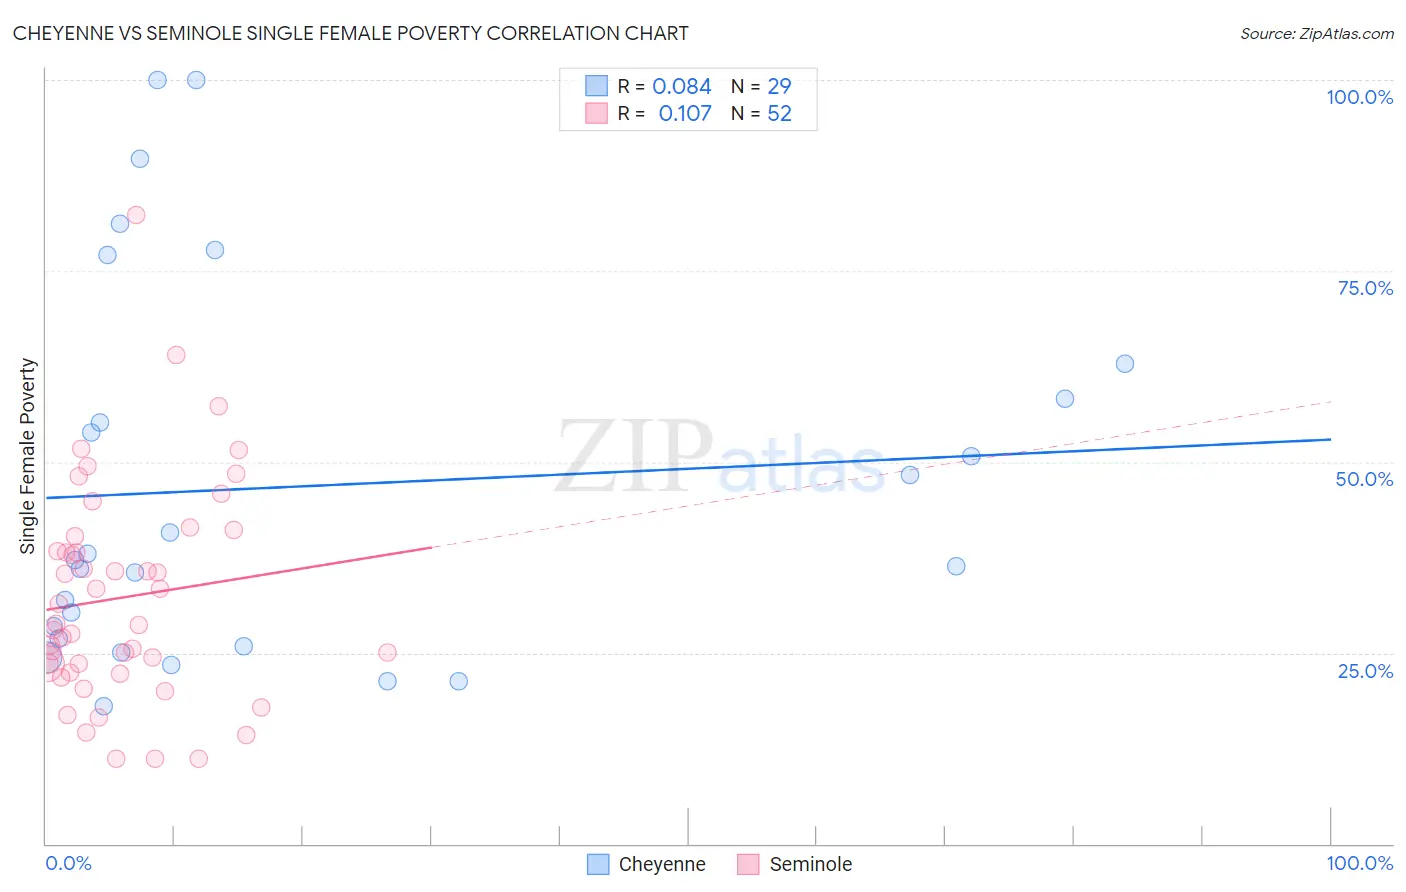
Cheyenne vs Seminole Single Female Poverty Correlation Chart
The statistical analysis conducted on geographies consisting of 80,467,038 people shows a slight positive correlation between the proportion of Cheyenne and poverty level among single females in the United States with a correlation coefficient (R) of 0.084 and weighted average of 30.4%. Similarly, the statistical analysis conducted on geographies consisting of 117,983,009 people shows a poor positive correlation between the proportion of Seminole and poverty level among single females in the United States with a correlation coefficient (R) of 0.107 and weighted average of 26.8%, a difference of 13.4%.
Single Female Poverty Correlation Summary
| Measurement | Cheyenne | Seminole |
| Minimum | 18.0% | 11.1% |
| Maximum | 100.0% | 82.4% |
| Range | 82.0% | 71.2% |
| Mean | 46.7% | 32.3% |
| Median | 37.1% | 28.7% |
| Interquartile 25% (IQ1) | 26.3% | 23.0% |
| Interquartile 75% (IQ3) | 60.6% | 39.2% |
| Interquartile Range (IQR) | 34.3% | 16.2% |
| Standard Deviation (Sample) | 24.6% | 14.2% |
| Standard Deviation (Population) | 24.2% | 14.1% |
Demographics Similar to Cheyenne and Seminole by Single Female Poverty
In terms of single female poverty, the demographic groups most similar to Cheyenne are Pima (30.3%, a difference of 0.22%), Cajun (30.6%, a difference of 0.81%), Yuman (29.4%, a difference of 3.2%), Colville (29.1%, a difference of 4.5%), and Immigrants from Yemen (28.9%, a difference of 5.1%). Similarly, the demographic groups most similar to Seminole are Chippewa (26.8%, a difference of 0.10%), Kiowa (26.9%, a difference of 0.52%), Yup'ik (26.6%, a difference of 0.74%), Arapaho (26.4%, a difference of 1.4%), and Choctaw (27.2%, a difference of 1.5%).
| Demographics | Rating | Rank | Single Female Poverty |
| Arapaho | 0.0 /100 | #320 | Tragic 26.4% |
| Yup'ik | 0.0 /100 | #321 | Tragic 26.6% |
| Seminole | 0.0 /100 | #322 | Tragic 26.8% |
| Chippewa | 0.0 /100 | #323 | Tragic 26.8% |
| Kiowa | 0.0 /100 | #324 | Tragic 26.9% |
| Choctaw | 0.0 /100 | #325 | Tragic 27.2% |
| Creek | 0.0 /100 | #326 | Tragic 27.4% |
| Dutch West Indians | 0.0 /100 | #327 | Tragic 27.5% |
| Apache | 0.0 /100 | #328 | Tragic 27.7% |
| Menominee | 0.0 /100 | #329 | Tragic 27.8% |
| Hopi | 0.0 /100 | #330 | Tragic 28.0% |
| Natives/Alaskans | 0.0 /100 | #331 | Tragic 28.2% |
| Yakama | 0.0 /100 | #332 | Tragic 28.3% |
| Ute | 0.0 /100 | #333 | Tragic 28.4% |
| Pueblo | 0.0 /100 | #334 | Tragic 28.6% |
| Immigrants | Yemen | 0.0 /100 | #335 | Tragic 28.9% |
| Colville | 0.0 /100 | #336 | Tragic 29.1% |
| Yuman | 0.0 /100 | #337 | Tragic 29.4% |
| Pima | 0.0 /100 | #338 | Tragic 30.3% |
| Cheyenne | 0.0 /100 | #339 | Tragic 30.4% |
| Cajuns | 0.0 /100 | #340 | Tragic 30.6% |