Scotch-Irish vs Polish Unemployment Among Ages 16 to 19 years
COMPARE
Scotch-Irish
Polish
Unemployment Among Ages 16 to 19 years
Unemployment Among Ages 16 to 19 years Comparison
Scotch-Irish
Poles
16.6%
UNEMPLOYMENT AMONG AGES 16 TO 19 YEARS
99.1/ 100
METRIC RATING
63rd/ 347
METRIC RANK
16.4%
UNEMPLOYMENT AMONG AGES 16 TO 19 YEARS
99.7/ 100
METRIC RATING
45th/ 347
METRIC RANK
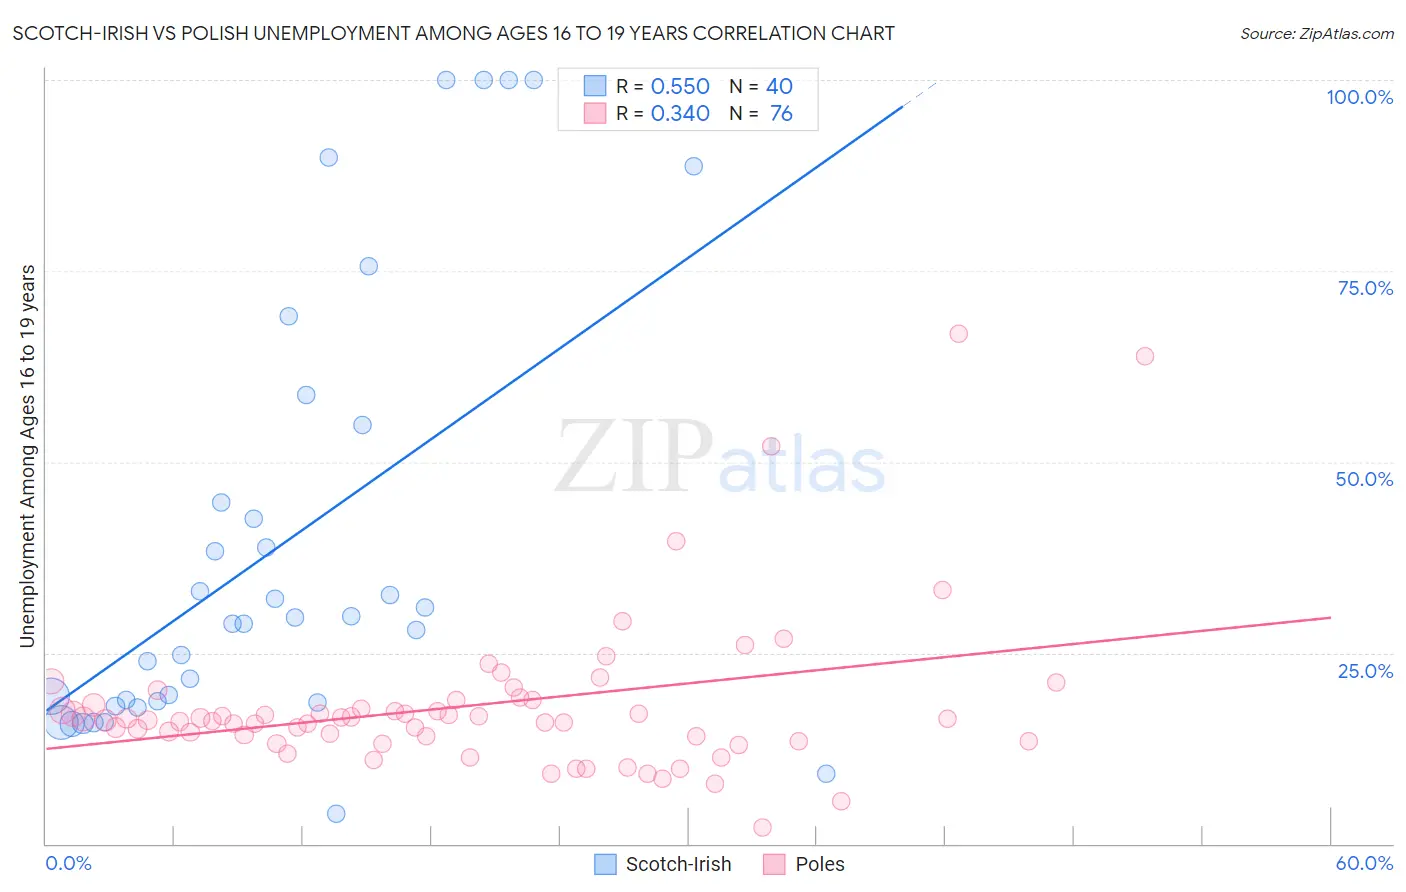
Scotch-Irish vs Polish Unemployment Among Ages 16 to 19 years Correlation Chart
The statistical analysis conducted on geographies consisting of 491,977,609 people shows a substantial positive correlation between the proportion of Scotch-Irish and unemployment rate among population between the ages 16 and 19 in the United States with a correlation coefficient (R) of 0.550 and weighted average of 16.6%. Similarly, the statistical analysis conducted on geographies consisting of 501,289,660 people shows a mild positive correlation between the proportion of Poles and unemployment rate among population between the ages 16 and 19 in the United States with a correlation coefficient (R) of 0.340 and weighted average of 16.4%, a difference of 1.6%.
Unemployment Among Ages 16 to 19 years Correlation Summary
| Measurement | Scotch-Irish | Polish |
| Minimum | 3.9% | 2.1% |
| Maximum | 100.0% | 66.7% |
| Range | 96.1% | 64.6% |
| Mean | 39.2% | 18.1% |
| Median | 29.2% | 16.3% |
| Interquartile 25% (IQ1) | 18.6% | 13.8% |
| Interquartile 75% (IQ3) | 49.8% | 18.5% |
| Interquartile Range (IQR) | 31.2% | 4.7% |
| Standard Deviation (Sample) | 28.6% | 10.5% |
| Standard Deviation (Population) | 28.3% | 10.4% |
Demographics Similar to Scotch-Irish and Poles by Unemployment Among Ages 16 to 19 years
In terms of unemployment among ages 16 to 19 years, the demographic groups most similar to Scotch-Irish are Northern European (16.6%, a difference of 0.070%), Macedonian (16.6%, a difference of 0.18%), Immigrants from Cuba (16.6%, a difference of 0.28%), Menominee (16.6%, a difference of 0.34%), and Irish (16.5%, a difference of 0.51%). Similarly, the demographic groups most similar to Poles are Immigrants from Zimbabwe (16.3%, a difference of 0.020%), Immigrants from North Macedonia (16.4%, a difference of 0.020%), Immigrants from Vietnam (16.4%, a difference of 0.090%), Maltese (16.4%, a difference of 0.14%), and Iraqi (16.4%, a difference of 0.21%).
| Demographics | Rating | Rank | Unemployment Among Ages 16 to 19 years |
| Immigrants | Zimbabwe | 99.7 /100 | #44 | Exceptional 16.3% |
| Poles | 99.7 /100 | #45 | Exceptional 16.4% |
| Immigrants | North Macedonia | 99.7 /100 | #46 | Exceptional 16.4% |
| Immigrants | Vietnam | 99.7 /100 | #47 | Exceptional 16.4% |
| Maltese | 99.7 /100 | #48 | Exceptional 16.4% |
| Iraqis | 99.7 /100 | #49 | Exceptional 16.4% |
| Bhutanese | 99.6 /100 | #50 | Exceptional 16.4% |
| Lebanese | 99.6 /100 | #51 | Exceptional 16.4% |
| Welsh | 99.6 /100 | #52 | Exceptional 16.4% |
| Slovenes | 99.6 /100 | #53 | Exceptional 16.4% |
| British | 99.5 /100 | #54 | Exceptional 16.5% |
| Czechoslovakians | 99.5 /100 | #55 | Exceptional 16.5% |
| Sri Lankans | 99.5 /100 | #56 | Exceptional 16.5% |
| Immigrants | Jordan | 99.4 /100 | #57 | Exceptional 16.5% |
| Immigrants | Uganda | 99.4 /100 | #58 | Exceptional 16.5% |
| Irish | 99.4 /100 | #59 | Exceptional 16.5% |
| Menominee | 99.3 /100 | #60 | Exceptional 16.6% |
| Immigrants | Cuba | 99.2 /100 | #61 | Exceptional 16.6% |
| Macedonians | 99.2 /100 | #62 | Exceptional 16.6% |
| Scotch-Irish | 99.1 /100 | #63 | Exceptional 16.6% |
| Northern Europeans | 99.0 /100 | #64 | Exceptional 16.6% |