Pima vs Immigrants from Nepal Single Male Poverty
COMPARE
Pima
Immigrants from Nepal
Single Male Poverty
Single Male Poverty Comparison
Pima
Immigrants from Nepal
20.2%
SINGLE MALE POVERTY
0.0/ 100
METRIC RATING
334th/ 347
METRIC RANK
11.9%
SINGLE MALE POVERTY
99.6/ 100
METRIC RATING
70th/ 347
METRIC RANK
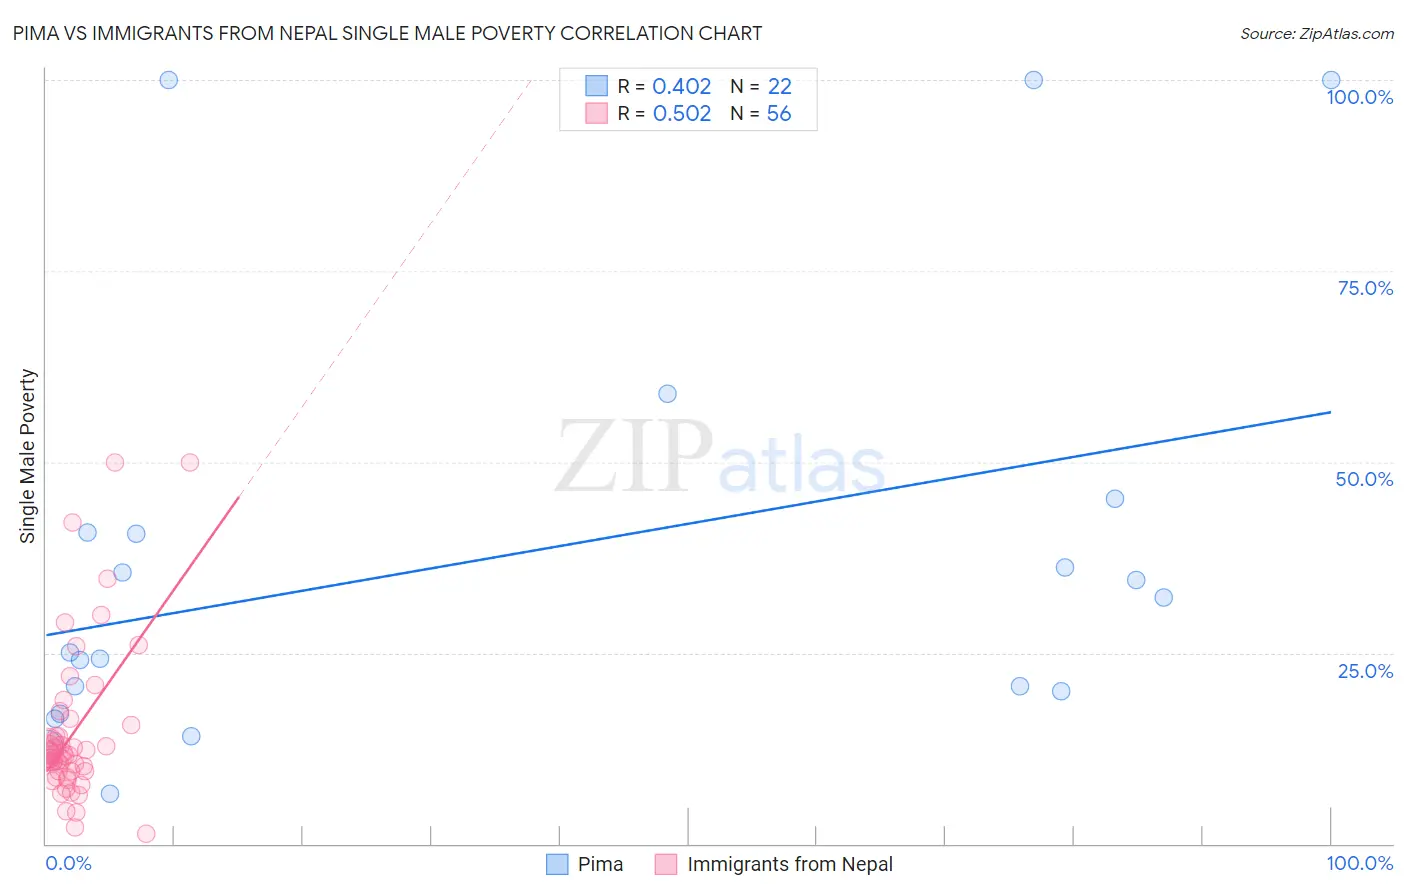
Pima vs Immigrants from Nepal Single Male Poverty Correlation Chart
The statistical analysis conducted on geographies consisting of 60,152,261 people shows a moderate positive correlation between the proportion of Pima and poverty level among single males in the United States with a correlation coefficient (R) of 0.402 and weighted average of 20.2%. Similarly, the statistical analysis conducted on geographies consisting of 173,608,756 people shows a substantial positive correlation between the proportion of Immigrants from Nepal and poverty level among single males in the United States with a correlation coefficient (R) of 0.502 and weighted average of 11.9%, a difference of 69.8%.
Single Male Poverty Correlation Summary
| Measurement | Pima | Immigrants from Nepal |
| Minimum | 6.5% | 1.2% |
| Maximum | 100.0% | 50.0% |
| Range | 93.5% | 48.8% |
| Mean | 37.5% | 14.6% |
| Median | 28.6% | 11.6% |
| Interquartile 25% (IQ1) | 20.0% | 9.4% |
| Interquartile 75% (IQ3) | 40.7% | 14.8% |
| Interquartile Range (IQR) | 20.7% | 5.4% |
| Standard Deviation (Sample) | 28.2% | 10.3% |
| Standard Deviation (Population) | 27.5% | 10.2% |
Similar Demographics by Single Male Poverty
Demographics Similar to Pima by Single Male Poverty
In terms of single male poverty, the demographic groups most similar to Pima are Inupiat (20.0%, a difference of 0.80%), Native/Alaskan (19.6%, a difference of 2.7%), Paiute (19.3%, a difference of 4.4%), Cajun (19.1%, a difference of 5.7%), and Yuman (21.3%, a difference of 5.7%).
| Demographics | Rating | Rank | Single Male Poverty |
| Menominee | 0.0 /100 | #327 | Tragic 17.7% |
| Kiowa | 0.0 /100 | #328 | Tragic 18.3% |
| Colville | 0.0 /100 | #329 | Tragic 18.4% |
| Cajuns | 0.0 /100 | #330 | Tragic 19.1% |
| Paiute | 0.0 /100 | #331 | Tragic 19.3% |
| Natives/Alaskans | 0.0 /100 | #332 | Tragic 19.6% |
| Inupiat | 0.0 /100 | #333 | Tragic 20.0% |
| Pima | 0.0 /100 | #334 | Tragic 20.2% |
| Yuman | 0.0 /100 | #335 | Tragic 21.3% |
| Tohono O'odham | 0.0 /100 | #336 | Tragic 21.6% |
| Apache | 0.0 /100 | #337 | Tragic 21.6% |
| Pueblo | 0.0 /100 | #338 | Tragic 21.6% |
| Arapaho | 0.0 /100 | #339 | Tragic 21.9% |
| Sioux | 0.0 /100 | #340 | Tragic 22.2% |
| Crow | 0.0 /100 | #341 | Tragic 23.3% |
Demographics Similar to Immigrants from Nepal by Single Male Poverty
In terms of single male poverty, the demographic groups most similar to Immigrants from Nepal are Immigrants from Russia (11.9%, a difference of 0.020%), Immigrants from Croatia (11.9%, a difference of 0.040%), Immigrants from Ukraine (11.9%, a difference of 0.060%), Immigrants from Greece (11.9%, a difference of 0.060%), and Laotian (11.9%, a difference of 0.080%).
| Demographics | Rating | Rank | Single Male Poverty |
| Immigrants | Belarus | 99.7 /100 | #63 | Exceptional 11.8% |
| Immigrants | Eastern Europe | 99.6 /100 | #64 | Exceptional 11.8% |
| Laotians | 99.6 /100 | #65 | Exceptional 11.9% |
| Immigrants | Uruguay | 99.6 /100 | #66 | Exceptional 11.9% |
| Immigrants | Ukraine | 99.6 /100 | #67 | Exceptional 11.9% |
| Immigrants | Croatia | 99.6 /100 | #68 | Exceptional 11.9% |
| Immigrants | Russia | 99.6 /100 | #69 | Exceptional 11.9% |
| Immigrants | Nepal | 99.6 /100 | #70 | Exceptional 11.9% |
| Immigrants | Greece | 99.6 /100 | #71 | Exceptional 11.9% |
| Immigrants | Argentina | 99.5 /100 | #72 | Exceptional 11.9% |
| Argentineans | 99.5 /100 | #73 | Exceptional 11.9% |
| Chileans | 99.5 /100 | #74 | Exceptional 11.9% |
| Uruguayans | 99.4 /100 | #75 | Exceptional 11.9% |
| Immigrants | Northern Africa | 99.4 /100 | #76 | Exceptional 11.9% |
| Immigrants | Malaysia | 99.2 /100 | #77 | Exceptional 12.0% |