Nicaraguan vs Immigrants from Bulgaria Female Poverty
COMPARE
Nicaraguan
Immigrants from Bulgaria
Female Poverty
Female Poverty Comparison
Nicaraguans
Immigrants from Bulgaria
15.3%
FEMALE POVERTY
0.3/ 100
METRIC RATING
243rd/ 347
METRIC RANK
12.0%
FEMALE POVERTY
98.9/ 100
METRIC RATING
51st/ 347
METRIC RANK
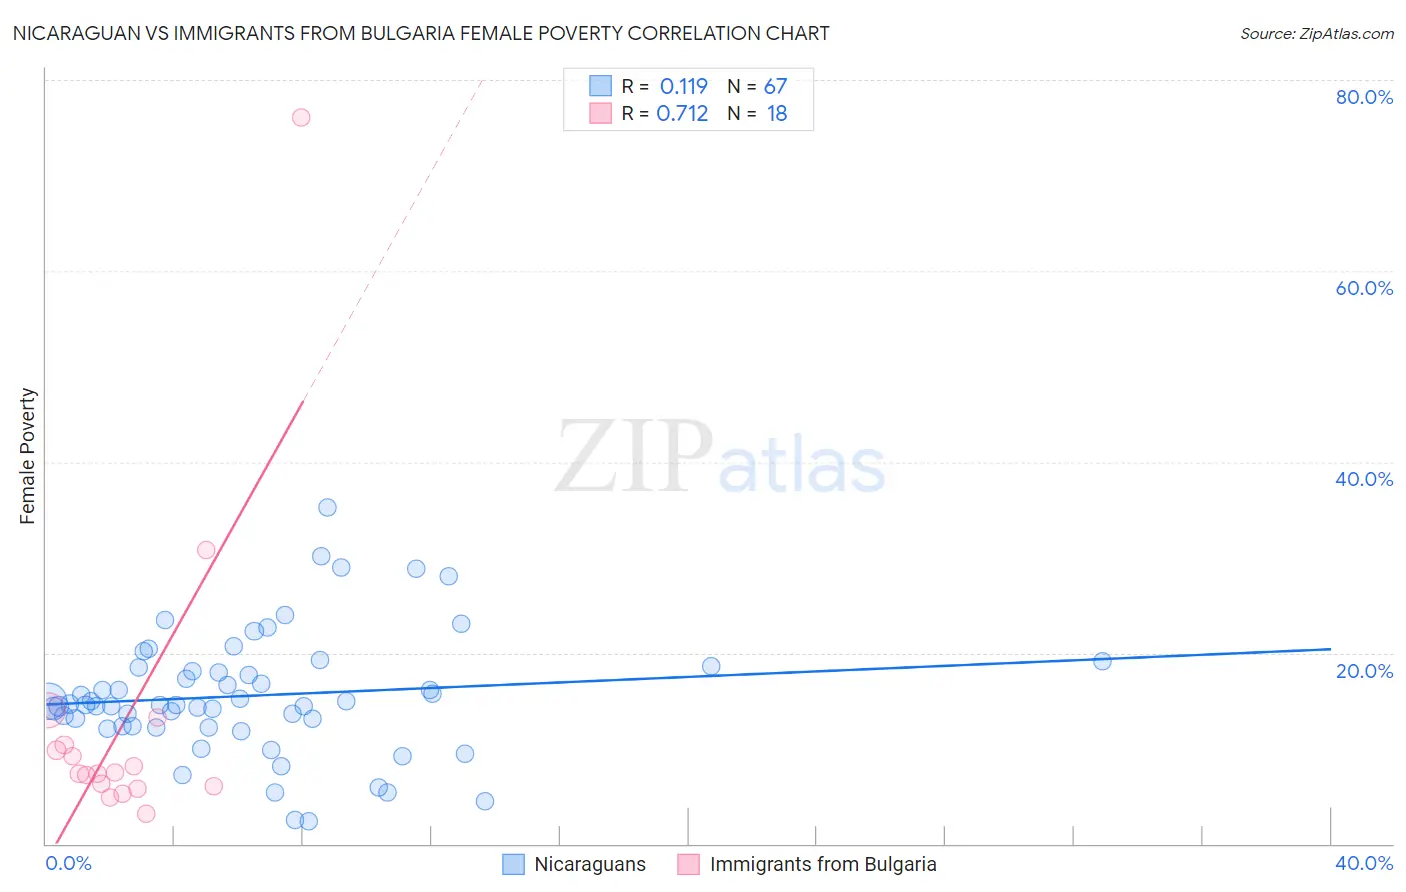
Nicaraguan vs Immigrants from Bulgaria Female Poverty Correlation Chart
The statistical analysis conducted on geographies consisting of 285,582,633 people shows a poor positive correlation between the proportion of Nicaraguans and poverty level among females in the United States with a correlation coefficient (R) of 0.119 and weighted average of 15.3%. Similarly, the statistical analysis conducted on geographies consisting of 172,523,298 people shows a strong positive correlation between the proportion of Immigrants from Bulgaria and poverty level among females in the United States with a correlation coefficient (R) of 0.712 and weighted average of 12.0%, a difference of 27.3%.
Female Poverty Correlation Summary
| Measurement | Nicaraguan | Immigrants from Bulgaria |
| Minimum | 2.4% | 3.1% |
| Maximum | 35.3% | 76.0% |
| Range | 32.9% | 72.9% |
| Mean | 15.5% | 12.9% |
| Median | 14.6% | 7.4% |
| Interquartile 25% (IQ1) | 12.3% | 6.0% |
| Interquartile 75% (IQ3) | 18.5% | 10.3% |
| Interquartile Range (IQR) | 6.2% | 4.3% |
| Standard Deviation (Sample) | 6.4% | 16.9% |
| Standard Deviation (Population) | 6.3% | 16.4% |
Similar Demographics by Female Poverty
Demographics Similar to Nicaraguans by Female Poverty
In terms of female poverty, the demographic groups most similar to Nicaraguans are Ecuadorian (15.3%, a difference of 0.050%), Spanish American Indian (15.3%, a difference of 0.15%), Cuban (15.3%, a difference of 0.20%), Potawatomi (15.3%, a difference of 0.21%), and Immigrants from Ghana (15.3%, a difference of 0.21%).
| Demographics | Rating | Rank | Female Poverty |
| Cree | 0.7 /100 | #236 | Tragic 15.1% |
| French American Indians | 0.6 /100 | #237 | Tragic 15.1% |
| Immigrants | Armenia | 0.6 /100 | #238 | Tragic 15.1% |
| Immigrants | Middle Africa | 0.5 /100 | #239 | Tragic 15.2% |
| Sudanese | 0.5 /100 | #240 | Tragic 15.2% |
| Immigrants | Sudan | 0.4 /100 | #241 | Tragic 15.2% |
| Nepalese | 0.4 /100 | #242 | Tragic 15.2% |
| Nicaraguans | 0.3 /100 | #243 | Tragic 15.3% |
| Ecuadorians | 0.3 /100 | #244 | Tragic 15.3% |
| Spanish American Indians | 0.3 /100 | #245 | Tragic 15.3% |
| Cubans | 0.3 /100 | #246 | Tragic 15.3% |
| Potawatomi | 0.3 /100 | #247 | Tragic 15.3% |
| Immigrants | Ghana | 0.3 /100 | #248 | Tragic 15.3% |
| Salvadorans | 0.3 /100 | #249 | Tragic 15.3% |
| Immigrants | Western Africa | 0.3 /100 | #250 | Tragic 15.3% |
Demographics Similar to Immigrants from Bulgaria by Female Poverty
In terms of female poverty, the demographic groups most similar to Immigrants from Bulgaria are Slovene (12.0%, a difference of 0.22%), Immigrants from Romania (12.0%, a difference of 0.23%), Immigrants from Croatia (12.0%, a difference of 0.31%), Immigrants from Austria (12.0%, a difference of 0.31%), and Immigrants from Japan (11.9%, a difference of 0.42%).
| Demographics | Rating | Rank | Female Poverty |
| Tongans | 99.2 /100 | #44 | Exceptional 11.9% |
| Immigrants | Czechoslovakia | 99.2 /100 | #45 | Exceptional 11.9% |
| Turks | 99.2 /100 | #46 | Exceptional 11.9% |
| Asians | 99.1 /100 | #47 | Exceptional 11.9% |
| Immigrants | Japan | 99.0 /100 | #48 | Exceptional 11.9% |
| Immigrants | Romania | 99.0 /100 | #49 | Exceptional 12.0% |
| Slovenes | 98.9 /100 | #50 | Exceptional 12.0% |
| Immigrants | Bulgaria | 98.9 /100 | #51 | Exceptional 12.0% |
| Immigrants | Croatia | 98.7 /100 | #52 | Exceptional 12.0% |
| Immigrants | Austria | 98.7 /100 | #53 | Exceptional 12.0% |
| Immigrants | Philippines | 98.7 /100 | #54 | Exceptional 12.1% |
| Immigrants | Sri Lanka | 98.5 /100 | #55 | Exceptional 12.1% |
| Estonians | 98.3 /100 | #56 | Exceptional 12.1% |
| Immigrants | Serbia | 98.3 /100 | #57 | Exceptional 12.1% |
| Scandinavians | 98.2 /100 | #58 | Exceptional 12.1% |