Immigrants from South Eastern Asia vs Immigrants from Saudi Arabia Single Father Poverty
COMPARE
Immigrants from South Eastern Asia
Immigrants from Saudi Arabia
Single Father Poverty
Single Father Poverty Comparison
Immigrants from South Eastern Asia
Immigrants from Saudi Arabia
14.4%
SINGLE FATHER POVERTY
100.0/ 100
METRIC RATING
24th/ 347
METRIC RANK
16.9%
SINGLE FATHER POVERTY
2.7/ 100
METRIC RATING
238th/ 347
METRIC RANK
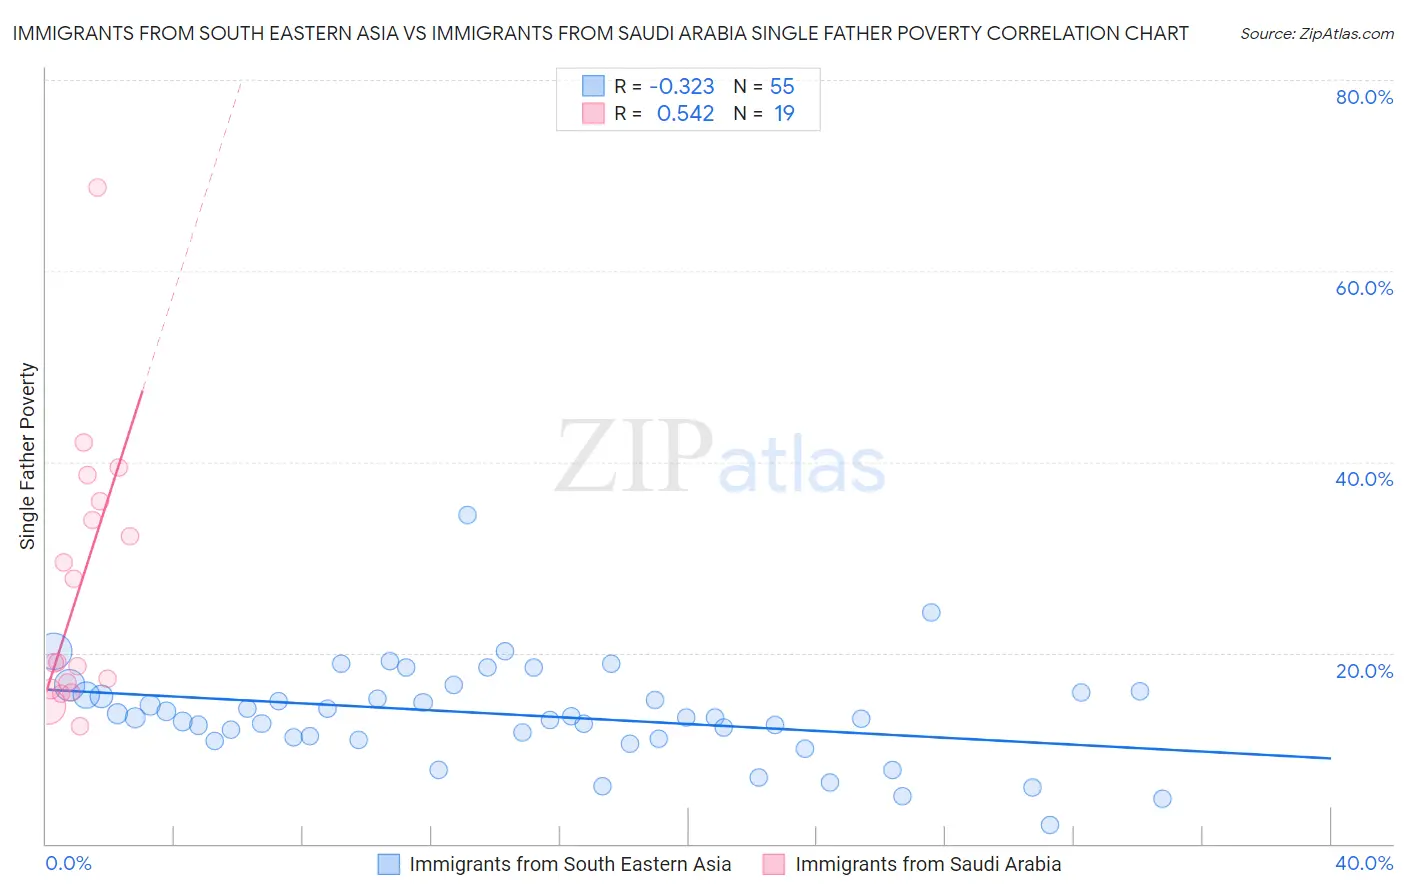
Immigrants from South Eastern Asia vs Immigrants from Saudi Arabia Single Father Poverty Correlation Chart
The statistical analysis conducted on geographies consisting of 383,820,731 people shows a mild negative correlation between the proportion of Immigrants from South Eastern Asia and poverty level among single fathers in the United States with a correlation coefficient (R) of -0.323 and weighted average of 14.4%. Similarly, the statistical analysis conducted on geographies consisting of 144,012,732 people shows a substantial positive correlation between the proportion of Immigrants from Saudi Arabia and poverty level among single fathers in the United States with a correlation coefficient (R) of 0.542 and weighted average of 16.9%, a difference of 18.0%.
Single Father Poverty Correlation Summary
| Measurement | Immigrants from South Eastern Asia | Immigrants from Saudi Arabia |
| Minimum | 2.0% | 12.3% |
| Maximum | 34.5% | 68.8% |
| Range | 32.5% | 56.4% |
| Mean | 13.5% | 27.0% |
| Median | 13.2% | 19.0% |
| Interquartile 25% (IQ1) | 11.0% | 16.2% |
| Interquartile 75% (IQ3) | 15.8% | 35.9% |
| Interquartile Range (IQR) | 4.8% | 19.7% |
| Standard Deviation (Sample) | 5.2% | 14.1% |
| Standard Deviation (Population) | 5.2% | 13.7% |
Similar Demographics by Single Father Poverty
Demographics Similar to Immigrants from South Eastern Asia by Single Father Poverty
In terms of single father poverty, the demographic groups most similar to Immigrants from South Eastern Asia are Immigrants from Egypt (14.4%, a difference of 0.010%), Iranian (14.4%, a difference of 0.030%), Taiwanese (14.3%, a difference of 0.21%), Spanish American Indian (14.4%, a difference of 0.46%), and Nepalese (14.4%, a difference of 0.51%).
| Demographics | Rating | Rank | Single Father Poverty |
| Immigrants | Hong Kong | 100.0 /100 | #17 | Exceptional 14.2% |
| Soviet Union | 100.0 /100 | #18 | Exceptional 14.3% |
| Immigrants | Iraq | 100.0 /100 | #19 | Exceptional 14.3% |
| Immigrants | Singapore | 100.0 /100 | #20 | Exceptional 14.3% |
| Immigrants | Afghanistan | 100.0 /100 | #21 | Exceptional 14.3% |
| Taiwanese | 100.0 /100 | #22 | Exceptional 14.3% |
| Immigrants | Egypt | 100.0 /100 | #23 | Exceptional 14.4% |
| Immigrants | South Eastern Asia | 100.0 /100 | #24 | Exceptional 14.4% |
| Iranians | 100.0 /100 | #25 | Exceptional 14.4% |
| Spanish American Indians | 100.0 /100 | #26 | Exceptional 14.4% |
| Nepalese | 100.0 /100 | #27 | Exceptional 14.4% |
| Immigrants | South Central Asia | 100.0 /100 | #28 | Exceptional 14.5% |
| Somalis | 100.0 /100 | #29 | Exceptional 14.5% |
| Thais | 100.0 /100 | #30 | Exceptional 14.5% |
| Icelanders | 100.0 /100 | #31 | Exceptional 14.5% |
Demographics Similar to Immigrants from Saudi Arabia by Single Father Poverty
In terms of single father poverty, the demographic groups most similar to Immigrants from Saudi Arabia are Bermudan (16.9%, a difference of 0.020%), Finnish (16.9%, a difference of 0.030%), Immigrants from Western Europe (16.9%, a difference of 0.070%), Immigrants from Germany (16.9%, a difference of 0.070%), and Subsaharan African (16.9%, a difference of 0.070%).
| Demographics | Rating | Rank | Single Father Poverty |
| Spanish Americans | 3.7 /100 | #231 | Tragic 16.9% |
| Immigrants | Grenada | 3.7 /100 | #232 | Tragic 16.9% |
| Senegalese | 3.2 /100 | #233 | Tragic 16.9% |
| Marshallese | 3.1 /100 | #234 | Tragic 16.9% |
| Immigrants | Western Europe | 2.9 /100 | #235 | Tragic 16.9% |
| Immigrants | Germany | 2.9 /100 | #236 | Tragic 16.9% |
| Sub-Saharan Africans | 2.9 /100 | #237 | Tragic 16.9% |
| Immigrants | Saudi Arabia | 2.7 /100 | #238 | Tragic 16.9% |
| Bermudans | 2.6 /100 | #239 | Tragic 16.9% |
| Finns | 2.6 /100 | #240 | Tragic 16.9% |
| Czechs | 2.3 /100 | #241 | Tragic 17.0% |
| Moroccans | 2.1 /100 | #242 | Tragic 17.0% |
| Immigrants | Cabo Verde | 1.6 /100 | #243 | Tragic 17.0% |
| Hondurans | 1.6 /100 | #244 | Tragic 17.0% |
| Trinidadians and Tobagonians | 1.5 /100 | #245 | Tragic 17.0% |