Immigrants from Nepal vs Immigrants from Saudi Arabia Single Father Poverty
COMPARE
Immigrants from Nepal
Immigrants from Saudi Arabia
Single Father Poverty
Single Father Poverty Comparison
Immigrants from Nepal
Immigrants from Saudi Arabia
14.8%
SINGLE FATHER POVERTY
100.0/ 100
METRIC RATING
42nd/ 347
METRIC RANK
16.9%
SINGLE FATHER POVERTY
2.7/ 100
METRIC RATING
238th/ 347
METRIC RANK
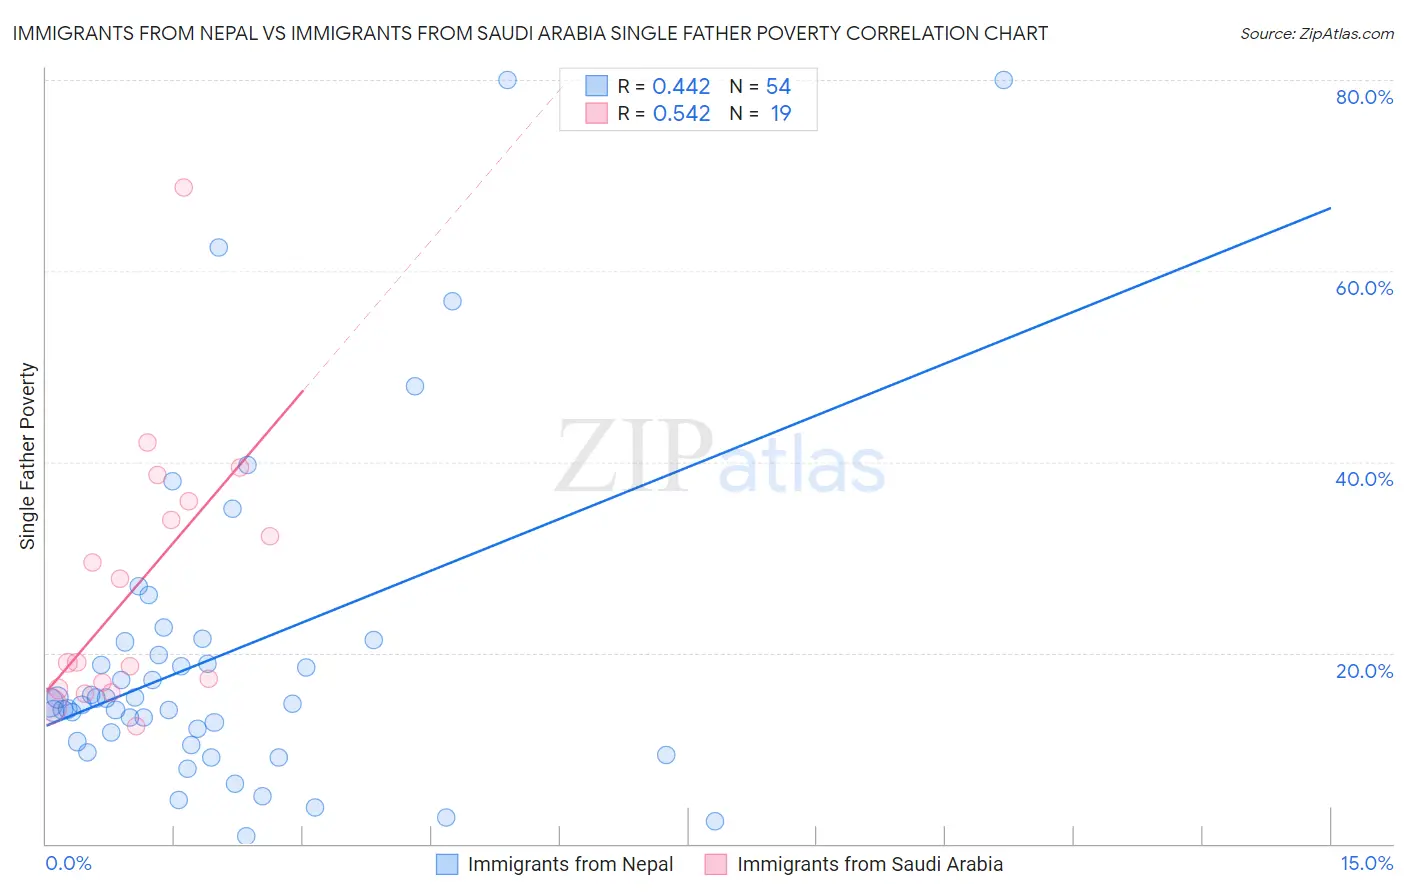
Immigrants from Nepal vs Immigrants from Saudi Arabia Single Father Poverty Correlation Chart
The statistical analysis conducted on geographies consisting of 159,641,053 people shows a moderate positive correlation between the proportion of Immigrants from Nepal and poverty level among single fathers in the United States with a correlation coefficient (R) of 0.442 and weighted average of 14.8%. Similarly, the statistical analysis conducted on geographies consisting of 144,012,732 people shows a substantial positive correlation between the proportion of Immigrants from Saudi Arabia and poverty level among single fathers in the United States with a correlation coefficient (R) of 0.542 and weighted average of 16.9%, a difference of 14.5%.
Single Father Poverty Correlation Summary
| Measurement | Immigrants from Nepal | Immigrants from Saudi Arabia |
| Minimum | 0.76% | 12.3% |
| Maximum | 80.0% | 68.8% |
| Range | 79.2% | 56.4% |
| Mean | 19.8% | 27.0% |
| Median | 14.8% | 19.0% |
| Interquartile 25% (IQ1) | 10.7% | 16.2% |
| Interquartile 75% (IQ3) | 21.1% | 35.9% |
| Interquartile Range (IQR) | 10.5% | 19.7% |
| Standard Deviation (Sample) | 17.1% | 14.1% |
| Standard Deviation (Population) | 17.0% | 13.7% |
Similar Demographics by Single Father Poverty
Demographics Similar to Immigrants from Nepal by Single Father Poverty
In terms of single father poverty, the demographic groups most similar to Immigrants from Nepal are Indian (Asian) (14.8%, a difference of 0.0%), Immigrants from Eritrea (14.8%, a difference of 0.040%), Pima (14.8%, a difference of 0.17%), Immigrants from Asia (14.7%, a difference of 0.37%), and Bolivian (14.7%, a difference of 0.55%).
| Demographics | Rating | Rank | Single Father Poverty |
| Immigrants | Bolivia | 100.0 /100 | #35 | Exceptional 14.7% |
| Immigrants | Indonesia | 100.0 /100 | #36 | Exceptional 14.7% |
| Immigrants | Eastern Africa | 100.0 /100 | #37 | Exceptional 14.7% |
| Bolivians | 100.0 /100 | #38 | Exceptional 14.7% |
| Immigrants | Asia | 100.0 /100 | #39 | Exceptional 14.7% |
| Pima | 100.0 /100 | #40 | Exceptional 14.8% |
| Indians (Asian) | 100.0 /100 | #41 | Exceptional 14.8% |
| Immigrants | Nepal | 100.0 /100 | #42 | Exceptional 14.8% |
| Immigrants | Eritrea | 100.0 /100 | #43 | Exceptional 14.8% |
| Salvadorans | 100.0 /100 | #44 | Exceptional 14.9% |
| Immigrants | Somalia | 100.0 /100 | #45 | Exceptional 14.9% |
| Immigrants | Cambodia | 99.9 /100 | #46 | Exceptional 14.9% |
| Immigrants | China | 99.9 /100 | #47 | Exceptional 14.9% |
| Malaysians | 99.9 /100 | #48 | Exceptional 14.9% |
| Immigrants | Eastern Asia | 99.9 /100 | #49 | Exceptional 15.0% |
Demographics Similar to Immigrants from Saudi Arabia by Single Father Poverty
In terms of single father poverty, the demographic groups most similar to Immigrants from Saudi Arabia are Bermudan (16.9%, a difference of 0.020%), Finnish (16.9%, a difference of 0.030%), Immigrants from Western Europe (16.9%, a difference of 0.070%), Immigrants from Germany (16.9%, a difference of 0.070%), and Subsaharan African (16.9%, a difference of 0.070%).
| Demographics | Rating | Rank | Single Father Poverty |
| Spanish Americans | 3.7 /100 | #231 | Tragic 16.9% |
| Immigrants | Grenada | 3.7 /100 | #232 | Tragic 16.9% |
| Senegalese | 3.2 /100 | #233 | Tragic 16.9% |
| Marshallese | 3.1 /100 | #234 | Tragic 16.9% |
| Immigrants | Western Europe | 2.9 /100 | #235 | Tragic 16.9% |
| Immigrants | Germany | 2.9 /100 | #236 | Tragic 16.9% |
| Sub-Saharan Africans | 2.9 /100 | #237 | Tragic 16.9% |
| Immigrants | Saudi Arabia | 2.7 /100 | #238 | Tragic 16.9% |
| Bermudans | 2.6 /100 | #239 | Tragic 16.9% |
| Finns | 2.6 /100 | #240 | Tragic 16.9% |
| Czechs | 2.3 /100 | #241 | Tragic 17.0% |
| Moroccans | 2.1 /100 | #242 | Tragic 17.0% |
| Immigrants | Cabo Verde | 1.6 /100 | #243 | Tragic 17.0% |
| Hondurans | 1.6 /100 | #244 | Tragic 17.0% |
| Trinidadians and Tobagonians | 1.5 /100 | #245 | Tragic 17.0% |