Norwegian vs Immigrants from Nepal 3 or more Vehicles in Household
COMPARE
Norwegian
Immigrants from Nepal
3 or more Vehicles in Household
3 or more Vehicles in Household Comparison
Norwegians
Immigrants from Nepal
23.9%
3 OR MORE VEHICLES IN HOUSEHOLD
100.0/ 100
METRIC RATING
18th/ 347
METRIC RANK
17.6%
3 OR MORE VEHICLES IN HOUSEHOLD
0.6/ 100
METRIC RATING
270th/ 347
METRIC RANK
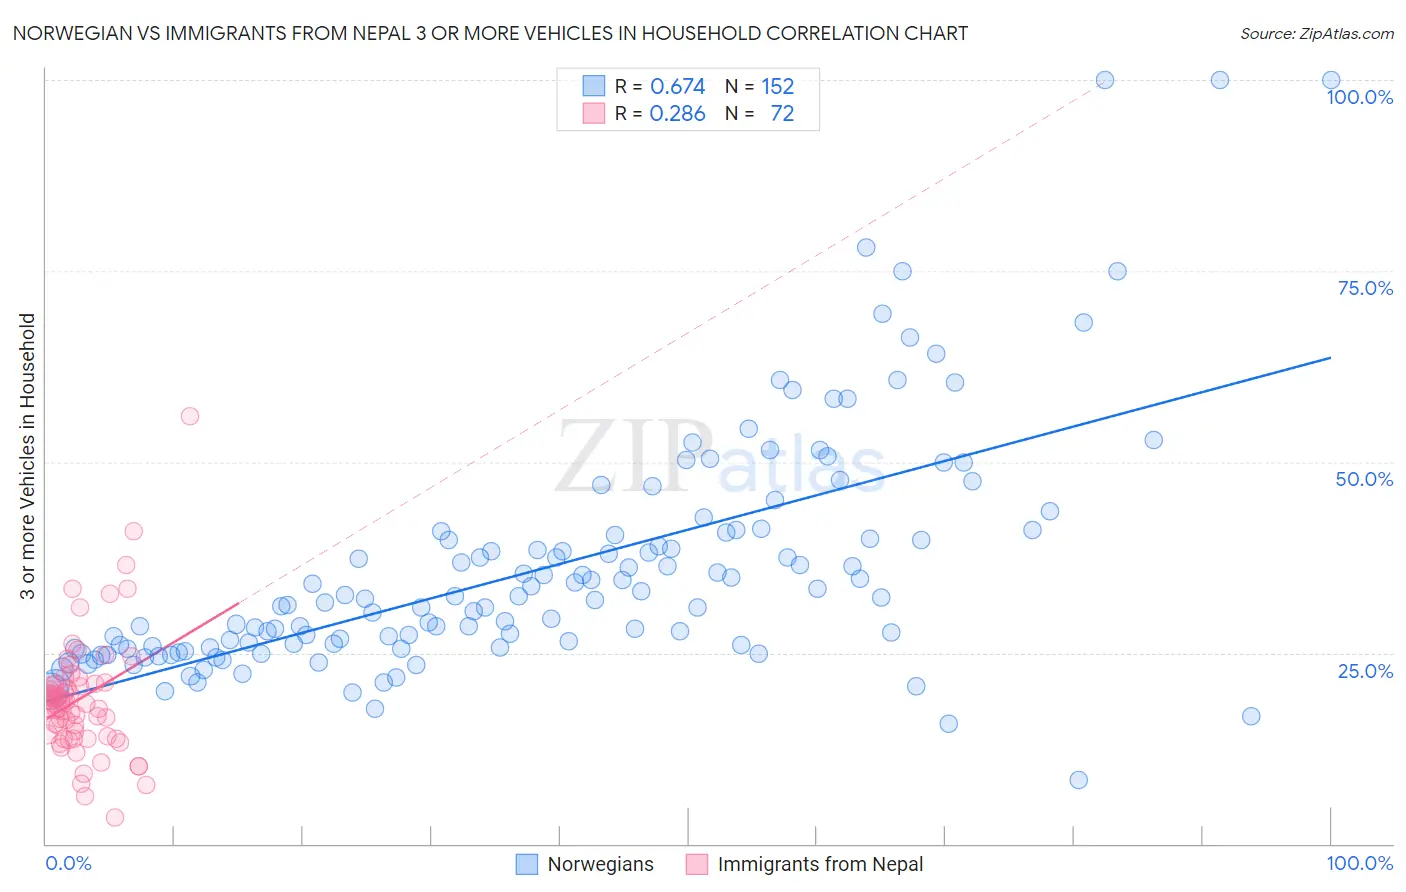
Norwegian vs Immigrants from Nepal 3 or more Vehicles in Household Correlation Chart
The statistical analysis conducted on geographies consisting of 532,701,273 people shows a significant positive correlation between the proportion of Norwegians and percentage of households with 3 or more vehicles available in the United States with a correlation coefficient (R) of 0.674 and weighted average of 23.9%. Similarly, the statistical analysis conducted on geographies consisting of 186,663,227 people shows a weak positive correlation between the proportion of Immigrants from Nepal and percentage of households with 3 or more vehicles available in the United States with a correlation coefficient (R) of 0.286 and weighted average of 17.6%, a difference of 35.4%.
3 or more Vehicles in Household Correlation Summary
| Measurement | Norwegian | Immigrants from Nepal |
| Minimum | 8.3% | 3.4% |
| Maximum | 100.0% | 55.9% |
| Range | 91.7% | 52.5% |
| Mean | 36.1% | 19.0% |
| Median | 32.0% | 18.3% |
| Interquartile 25% (IQ1) | 25.7% | 14.2% |
| Interquartile 75% (IQ3) | 40.6% | 21.0% |
| Interquartile Range (IQR) | 14.8% | 6.8% |
| Standard Deviation (Sample) | 15.8% | 8.0% |
| Standard Deviation (Population) | 15.7% | 8.0% |
Similar Demographics by 3 or more Vehicles in Household
Demographics Similar to Norwegians by 3 or more Vehicles in Household
In terms of 3 or more vehicles in household, the demographic groups most similar to Norwegians are Chinese (23.9%, a difference of 0.030%), Paiute (23.8%, a difference of 0.33%), Immigrants from Vietnam (23.8%, a difference of 0.45%), Immigrants from Philippines (23.8%, a difference of 0.51%), and Korean (24.1%, a difference of 0.79%).
| Demographics | Rating | Rank | 3 or more Vehicles in Household |
| Shoshone | 100.0 /100 | #11 | Exceptional 24.9% |
| Danes | 100.0 /100 | #12 | Exceptional 24.7% |
| Mexicans | 100.0 /100 | #13 | Exceptional 24.7% |
| Immigrants | Mexico | 100.0 /100 | #14 | Exceptional 24.6% |
| Hawaiians | 100.0 /100 | #15 | Exceptional 24.3% |
| Basques | 100.0 /100 | #16 | Exceptional 24.3% |
| Koreans | 100.0 /100 | #17 | Exceptional 24.1% |
| Norwegians | 100.0 /100 | #18 | Exceptional 23.9% |
| Chinese | 100.0 /100 | #19 | Exceptional 23.9% |
| Paiute | 100.0 /100 | #20 | Exceptional 23.8% |
| Immigrants | Vietnam | 100.0 /100 | #21 | Exceptional 23.8% |
| Immigrants | Philippines | 100.0 /100 | #22 | Exceptional 23.8% |
| Scandinavians | 100.0 /100 | #23 | Exceptional 23.6% |
| Sri Lankans | 100.0 /100 | #24 | Exceptional 23.6% |
| Immigrants | Central America | 100.0 /100 | #25 | Exceptional 23.4% |
Demographics Similar to Immigrants from Nepal by 3 or more Vehicles in Household
In terms of 3 or more vehicles in household, the demographic groups most similar to Immigrants from Nepal are South American (17.6%, a difference of 0.0%), Immigrants from France (17.6%, a difference of 0.050%), Immigrants from Africa (17.6%, a difference of 0.41%), Immigrants from Sudan (17.6%, a difference of 0.45%), and Immigrants from Bulgaria (17.7%, a difference of 0.47%).
| Demographics | Rating | Rank | 3 or more Vehicles in Household |
| Bermudans | 0.9 /100 | #263 | Tragic 17.8% |
| Cambodians | 0.9 /100 | #264 | Tragic 17.8% |
| Immigrants | Panama | 0.8 /100 | #265 | Tragic 17.7% |
| Macedonians | 0.8 /100 | #266 | Tragic 17.7% |
| Immigrants | Venezuela | 0.8 /100 | #267 | Tragic 17.7% |
| Immigrants | Bulgaria | 0.8 /100 | #268 | Tragic 17.7% |
| Immigrants | France | 0.6 /100 | #269 | Tragic 17.6% |
| Immigrants | Nepal | 0.6 /100 | #270 | Tragic 17.6% |
| South Americans | 0.6 /100 | #271 | Tragic 17.6% |
| Immigrants | Africa | 0.5 /100 | #272 | Tragic 17.6% |
| Immigrants | Sudan | 0.5 /100 | #273 | Tragic 17.6% |
| Immigrants | Bosnia and Herzegovina | 0.5 /100 | #274 | Tragic 17.5% |
| Immigrants | Ukraine | 0.4 /100 | #275 | Tragic 17.5% |
| Okinawans | 0.4 /100 | #276 | Tragic 17.4% |
| Brazilians | 0.4 /100 | #277 | Tragic 17.4% |