New Zealander vs Icelander Female Poverty
COMPARE
New Zealander
Icelander
Female Poverty
Female Poverty Comparison
New Zealanders
Icelanders
12.7%
FEMALE POVERTY
90.6/ 100
METRIC RATING
120th/ 347
METRIC RANK
13.0%
FEMALE POVERTY
81.1/ 100
METRIC RATING
141st/ 347
METRIC RANK
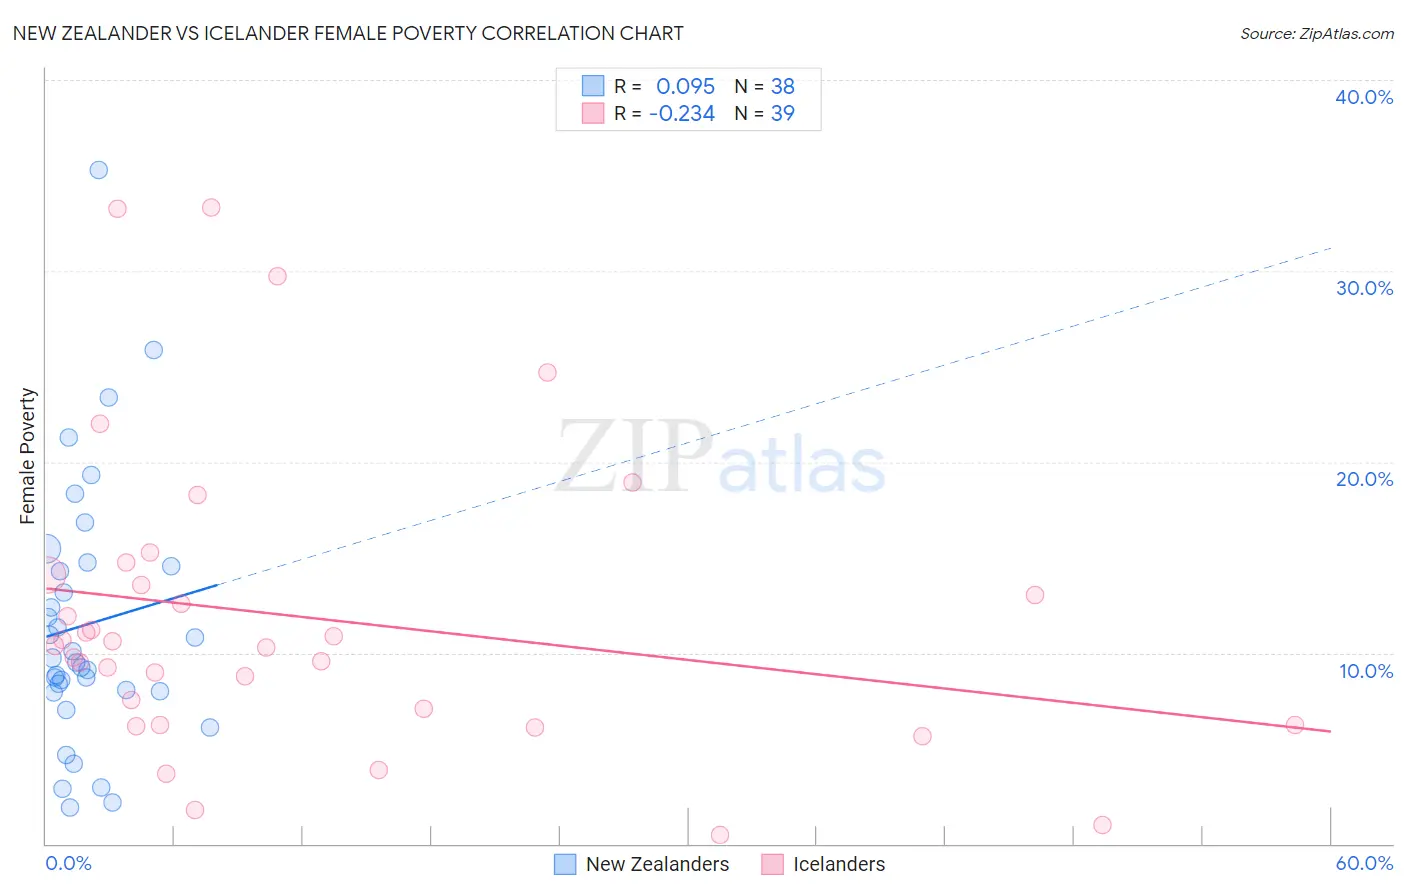
New Zealander vs Icelander Female Poverty Correlation Chart
The statistical analysis conducted on geographies consisting of 106,893,684 people shows a slight positive correlation between the proportion of New Zealanders and poverty level among females in the United States with a correlation coefficient (R) of 0.095 and weighted average of 12.7%. Similarly, the statistical analysis conducted on geographies consisting of 159,608,280 people shows a weak negative correlation between the proportion of Icelanders and poverty level among females in the United States with a correlation coefficient (R) of -0.234 and weighted average of 13.0%, a difference of 2.1%.
Female Poverty Correlation Summary
| Measurement | New Zealander | Icelander |
| Minimum | 1.9% | 0.47% |
| Maximum | 35.3% | 33.3% |
| Range | 33.4% | 32.9% |
| Mean | 11.5% | 11.8% |
| Median | 9.6% | 10.4% |
| Interquartile 25% (IQ1) | 8.0% | 6.2% |
| Interquartile 75% (IQ3) | 14.5% | 14.1% |
| Interquartile Range (IQR) | 6.5% | 7.8% |
| Standard Deviation (Sample) | 6.9% | 7.9% |
| Standard Deviation (Population) | 6.8% | 7.8% |
Similar Demographics by Female Poverty
Demographics Similar to New Zealanders by Female Poverty
In terms of female poverty, the demographic groups most similar to New Zealanders are Albanian (12.7%, a difference of 0.060%), Sri Lankan (12.7%, a difference of 0.070%), Immigrants from Southern Europe (12.7%, a difference of 0.090%), Immigrants from Hungary (12.7%, a difference of 0.10%), and French Canadian (12.7%, a difference of 0.14%).
| Demographics | Rating | Rank | Female Poverty |
| Canadians | 92.0 /100 | #113 | Exceptional 12.7% |
| Welsh | 91.6 /100 | #114 | Exceptional 12.7% |
| Puget Sound Salish | 91.5 /100 | #115 | Exceptional 12.7% |
| Immigrants | Russia | 91.2 /100 | #116 | Exceptional 12.7% |
| Immigrants | Southern Europe | 90.9 /100 | #117 | Exceptional 12.7% |
| Sri Lankans | 90.9 /100 | #118 | Exceptional 12.7% |
| Albanians | 90.8 /100 | #119 | Exceptional 12.7% |
| New Zealanders | 90.6 /100 | #120 | Exceptional 12.7% |
| Immigrants | Hungary | 90.3 /100 | #121 | Exceptional 12.7% |
| French Canadians | 90.2 /100 | #122 | Exceptional 12.7% |
| Immigrants | South Eastern Asia | 89.9 /100 | #123 | Excellent 12.7% |
| Immigrants | Norway | 89.3 /100 | #124 | Excellent 12.8% |
| Argentineans | 89.1 /100 | #125 | Excellent 12.8% |
| Immigrants | Ukraine | 88.8 /100 | #126 | Excellent 12.8% |
| South Africans | 88.4 /100 | #127 | Excellent 12.8% |
Demographics Similar to Icelanders by Female Poverty
In terms of female poverty, the demographic groups most similar to Icelanders are Brazilian (13.0%, a difference of 0.10%), Immigrants from Malaysia (13.0%, a difference of 0.12%), Afghan (13.0%, a difference of 0.21%), Syrian (13.0%, a difference of 0.24%), and Immigrants from Peru (13.0%, a difference of 0.31%).
| Demographics | Rating | Rank | Female Poverty |
| Immigrants | Switzerland | 85.8 /100 | #134 | Excellent 12.9% |
| French | 85.6 /100 | #135 | Excellent 12.9% |
| Peruvians | 85.2 /100 | #136 | Excellent 12.9% |
| Chileans | 84.7 /100 | #137 | Excellent 12.9% |
| Immigrants | France | 83.6 /100 | #138 | Excellent 12.9% |
| Basques | 83.1 /100 | #139 | Excellent 12.9% |
| Pakistanis | 83.0 /100 | #140 | Excellent 12.9% |
| Icelanders | 81.1 /100 | #141 | Excellent 13.0% |
| Brazilians | 80.5 /100 | #142 | Excellent 13.0% |
| Immigrants | Malaysia | 80.4 /100 | #143 | Excellent 13.0% |
| Afghans | 79.8 /100 | #144 | Good 13.0% |
| Syrians | 79.6 /100 | #145 | Good 13.0% |
| Immigrants | Peru | 79.1 /100 | #146 | Good 13.0% |
| Immigrants | Kazakhstan | 78.6 /100 | #147 | Good 13.0% |
| Yugoslavians | 76.9 /100 | #148 | Good 13.1% |