Alsatian vs Icelander Female Poverty
COMPARE
Alsatian
Icelander
Female Poverty
Female Poverty Comparison
Alsatians
Icelanders
14.5%
FEMALE POVERTY
4.0/ 100
METRIC RATING
220th/ 347
METRIC RANK
13.0%
FEMALE POVERTY
81.1/ 100
METRIC RATING
141st/ 347
METRIC RANK
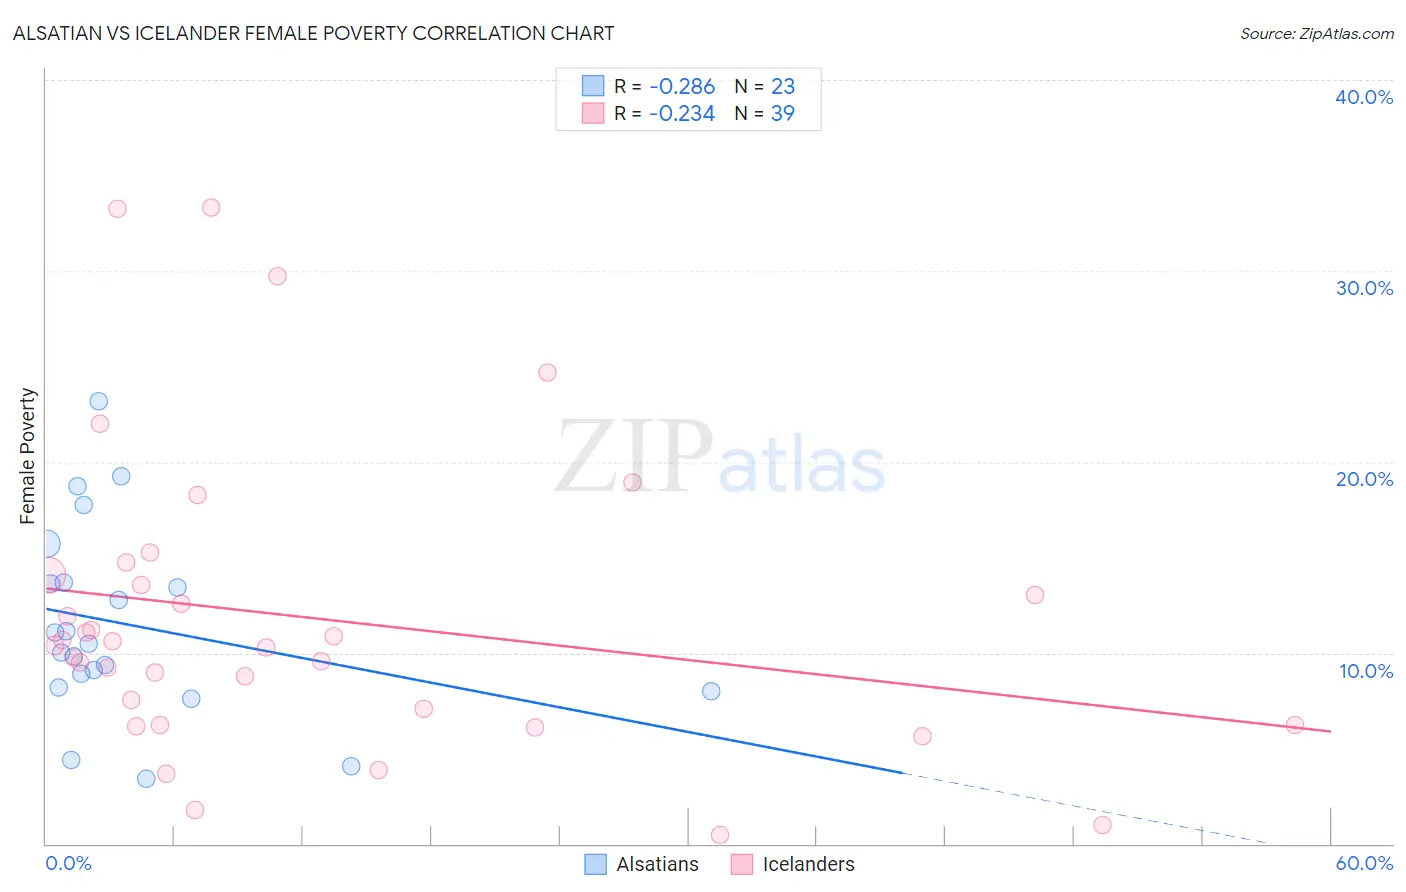
Alsatian vs Icelander Female Poverty Correlation Chart
The statistical analysis conducted on geographies consisting of 82,678,421 people shows a weak negative correlation between the proportion of Alsatians and poverty level among females in the United States with a correlation coefficient (R) of -0.286 and weighted average of 14.5%. Similarly, the statistical analysis conducted on geographies consisting of 159,608,280 people shows a weak negative correlation between the proportion of Icelanders and poverty level among females in the United States with a correlation coefficient (R) of -0.234 and weighted average of 13.0%, a difference of 11.5%.
Female Poverty Correlation Summary
| Measurement | Alsatian | Icelander |
| Minimum | 3.4% | 0.47% |
| Maximum | 23.1% | 33.3% |
| Range | 19.7% | 32.9% |
| Mean | 11.5% | 11.8% |
| Median | 10.5% | 10.4% |
| Interquartile 25% (IQ1) | 8.2% | 6.2% |
| Interquartile 75% (IQ3) | 13.7% | 14.1% |
| Interquartile Range (IQR) | 5.5% | 7.8% |
| Standard Deviation (Sample) | 5.0% | 7.9% |
| Standard Deviation (Population) | 4.9% | 7.8% |
Similar Demographics by Female Poverty
Demographics Similar to Alsatians by Female Poverty
In terms of female poverty, the demographic groups most similar to Alsatians are Japanese (14.5%, a difference of 0.050%), Immigrants from Uzbekistan (14.4%, a difference of 0.18%), Immigrants from Cambodia (14.5%, a difference of 0.19%), Nonimmigrants (14.5%, a difference of 0.22%), and Immigrants (14.4%, a difference of 0.23%).
| Demographics | Rating | Rank | Female Poverty |
| Alaskan Athabascans | 5.3 /100 | #213 | Tragic 14.4% |
| Marshallese | 5.0 /100 | #214 | Tragic 14.4% |
| Immigrants | Panama | 4.7 /100 | #215 | Tragic 14.4% |
| Immigrants | Thailand | 4.5 /100 | #216 | Tragic 14.4% |
| Immigrants | Immigrants | 4.5 /100 | #217 | Tragic 14.4% |
| Immigrants | Uzbekistan | 4.4 /100 | #218 | Tragic 14.4% |
| Japanese | 4.1 /100 | #219 | Tragic 14.5% |
| Alsatians | 4.0 /100 | #220 | Tragic 14.5% |
| Immigrants | Cambodia | 3.7 /100 | #221 | Tragic 14.5% |
| Immigrants | Nonimmigrants | 3.7 /100 | #222 | Tragic 14.5% |
| Immigrants | Africa | 3.3 /100 | #223 | Tragic 14.5% |
| Americans | 2.8 /100 | #224 | Tragic 14.6% |
| Immigrants | Micronesia | 2.8 /100 | #225 | Tragic 14.6% |
| Immigrants | Eritrea | 2.4 /100 | #226 | Tragic 14.6% |
| Immigrants | Nigeria | 2.1 /100 | #227 | Tragic 14.7% |
Demographics Similar to Icelanders by Female Poverty
In terms of female poverty, the demographic groups most similar to Icelanders are Brazilian (13.0%, a difference of 0.10%), Immigrants from Malaysia (13.0%, a difference of 0.12%), Afghan (13.0%, a difference of 0.21%), Syrian (13.0%, a difference of 0.24%), and Immigrants from Peru (13.0%, a difference of 0.31%).
| Demographics | Rating | Rank | Female Poverty |
| Immigrants | Switzerland | 85.8 /100 | #134 | Excellent 12.9% |
| French | 85.6 /100 | #135 | Excellent 12.9% |
| Peruvians | 85.2 /100 | #136 | Excellent 12.9% |
| Chileans | 84.7 /100 | #137 | Excellent 12.9% |
| Immigrants | France | 83.6 /100 | #138 | Excellent 12.9% |
| Basques | 83.1 /100 | #139 | Excellent 12.9% |
| Pakistanis | 83.0 /100 | #140 | Excellent 12.9% |
| Icelanders | 81.1 /100 | #141 | Excellent 13.0% |
| Brazilians | 80.5 /100 | #142 | Excellent 13.0% |
| Immigrants | Malaysia | 80.4 /100 | #143 | Excellent 13.0% |
| Afghans | 79.8 /100 | #144 | Good 13.0% |
| Syrians | 79.6 /100 | #145 | Good 13.0% |
| Immigrants | Peru | 79.1 /100 | #146 | Good 13.0% |
| Immigrants | Kazakhstan | 78.6 /100 | #147 | Good 13.0% |
| Yugoslavians | 76.9 /100 | #148 | Good 13.1% |