New Zealander vs Blackfeet Female Poverty

COMPARE

New Zealander
Race
Ancestry
AfghanAfricanAlaska NativeAlaskan AthabascanAlbanianAleutAlsatianAmericanApacheArabArapahoArgentineanArmenianAssyrian/Chaldean/SyriacAustralianAustrianBahamianBangladeshiBarbadianBasqueBelgianBelizeanBermudanBhutaneseBolivianBrazilianBritishBritish West IndianBulgarianBurmeseCajunCambodianCanadianCape VerdeanCarpatho RusynCelticCentral AmericanCentral American IndianCherokeeCheyenneChickasawChileanChineseChippewaChoctawColombianColvilleComancheCosta RicanCreeCreekCroatianCrowCubanCypriotCzechCzechoslovakianDanishDelawareDominicanDutchDutch West IndianEastern EuropeanEcuadorianEgyptianEnglishEstonianEthiopianEuropeanFijianFilipinoFinnishFrenchFrench American IndianFrench CanadianGermanGerman RussianGhanaianGreekGuamanian/ChamorroGuatemalanGuyaneseHaitianHmongHonduranHopiHoumaHungarianIcelanderIndian (Asian)IndonesianInupiatIranianIraqiIrishIroquoisIsraeliItalianJamaicanJapaneseJordanianKenyanKiowaKoreanLaotianLatvianLebaneseLiberianLithuanianLumbeeLuxembourgerMacedonianMalaysianMalteseMarshalleseMenomineeMexicanMexican American IndianMongolianMoroccanNative HawaiianNavajoNepaleseNew ZealanderNicaraguanNigerianNorthern EuropeanNorwegianOkinawanOsageOttawaPaiutePakistaniPalestinianPanamanianParaguayanPennsylvania GermanPeruvianPimaPolishPortuguesePotawatomiPuebloPuerto RicanPuget Sound SalishRomanianRussianSalvadoranSamoanScandinavianScotch-IrishScottishSeminoleSenegaleseSerbianShoshoneSierra LeoneanSiouxSlavicSlovakSloveneSomaliSouth AfricanSouth AmericanSouth American IndianSoviet UnionSpaniardSpanishSpanish AmericanSpanish American IndianSri LankanSubsaharan AfricanSudaneseSwedishSwissSyrianTaiwaneseThaiTlingit-HaidaTohono O'OdhamTonganTrinidadian and TobagonianTsimshianTurkishU.S. Virgin IslanderUgandanUkrainianUruguayanUteVenezuelanVietnameseWelshWest IndianYakamaYaquiYugoslavianYumanYup'ikZimbabwean
Immigration
NonimmigrantsImmigrantsAfghanistanAfricaAlbaniaArgentinaArmeniaAsiaAustraliaAustriaBahamasBangladeshBarbadosBelarusBelgiumBelizeBoliviaBosnia and HerzegovinaBrazilBulgariaBurma/MyanmarCabo VerdeCambodiaCameroonCanadaCaribbeanCentral AmericaChileChinaColombiaCongoCosta RicaCroatiaCubaCzechoslovakiaDenmarkDominicaDominican RepublicEastern AfricaEastern AsiaEastern EuropeEcuadorEgyptEl SalvadorEnglandEritreaEthiopiaEuropeFijiFranceGermanyGhanaGreeceGrenadaGuatemalaGuyanaHaitiHondurasHong KongHungaryIndiaIndonesiaIranIraqIrelandIsraelItalyJamaicaJapanJordanKazakhstanKenyaKoreaKuwaitLaosLatin AmericaLatviaLebanonLiberiaLithuaniaMalaysiaMexicoMicronesiaMiddle AfricaMoldovaMoroccoNepalNetherlandsNicaraguaNigeriaNorth AmericaNorth MacedoniaNorthern AfricaNorthern EuropeNorwayOceaniaPakistanPanamaPeruPhilippinesPolandPortugalRomaniaRussiaSaudi ArabiaScotlandSenegalSerbiaSierra LeoneSingaporeSomaliaSouth AfricaSouth AmericaSouth Central AsiaSouth Eastern AsiaSouthern EuropeSpainSri LankaSt. Vincent and the GrenadinesSudanSwedenSwitzerlandSyriaTaiwanThailandTrinidad and TobagoTurkeyUgandaUkraineUruguayUzbekistanVenezuelaVietnamWest IndiesWestern AfricaWestern AsiaWestern EuropeYemenZaireZimbabweAzores
Blackfeet
Race
Ancestry
AfghanAfricanAlaska NativeAlaskan AthabascanAlbanianAleutAlsatianAmericanApacheArabArapahoArgentineanArmenianAssyrian/Chaldean/SyriacAustralianAustrianBahamianBangladeshiBarbadianBasqueBelgianBelizeanBermudanBhutaneseBlackfeetBolivianBrazilianBritishBritish West IndianBulgarianBurmeseCajunCambodianCanadianCape VerdeanCarpatho RusynCelticCentral AmericanCentral American IndianCherokeeCheyenneChickasawChileanChineseChippewaChoctawColombianColvilleComancheCosta RicanCreeCreekCroatianCrowCubanCypriotCzechCzechoslovakianDanishDelawareDominicanDutchDutch West IndianEastern EuropeanEcuadorianEgyptianEnglishEstonianEthiopianEuropeanFijianFilipinoFinnishFrenchFrench American IndianFrench CanadianGermanGerman RussianGhanaianGreekGuamanian/ChamorroGuatemalanGuyaneseHaitianHmongHonduranHopiHoumaHungarianIcelanderIndian (Asian)IndonesianInupiatIranianIraqiIrishIroquoisIsraeliItalianJamaicanJapaneseJordanianKenyanKiowaKoreanLaotianLatvianLebaneseLiberianLithuanianLumbeeLuxembourgerMacedonianMalaysianMalteseMarshalleseMenomineeMexicanMexican American IndianMongolianMoroccanNative HawaiianNavajoNepaleseNicaraguanNigerianNorthern EuropeanNorwegianOkinawanOsageOttawaPaiutePakistaniPalestinianPanamanianParaguayanPennsylvania GermanPeruvianPimaPolishPortuguesePotawatomiPuebloPuerto RicanPuget Sound SalishRomanianRussianSalvadoranSamoanScandinavianScotch-IrishScottishSeminoleSenegaleseSerbianShoshoneSierra LeoneanSiouxSlavicSlovakSloveneSomaliSouth AfricanSouth AmericanSouth American IndianSoviet UnionSpaniardSpanishSpanish AmericanSpanish American IndianSri LankanSubsaharan AfricanSudaneseSwedishSwissSyrianTaiwaneseThaiTlingit-HaidaTohono O'OdhamTonganTrinidadian and TobagonianTsimshianTurkishU.S. Virgin IslanderUgandanUkrainianUruguayanUteVenezuelanVietnameseWelshWest IndianYakamaYaquiYugoslavianYumanYup'ikZimbabwean
Immigration
NonimmigrantsImmigrantsAfghanistanAfricaAlbaniaArgentinaArmeniaAsiaAustraliaAustriaBahamasBangladeshBarbadosBelarusBelgiumBelizeBoliviaBosnia and HerzegovinaBrazilBulgariaBurma/MyanmarCabo VerdeCambodiaCameroonCanadaCaribbeanCentral AmericaChileChinaColombiaCongoCosta RicaCroatiaCubaCzechoslovakiaDenmarkDominicaDominican RepublicEastern AfricaEastern AsiaEastern EuropeEcuadorEgyptEl SalvadorEnglandEritreaEthiopiaEuropeFijiFranceGermanyGhanaGreeceGrenadaGuatemalaGuyanaHaitiHondurasHong KongHungaryIndiaIndonesiaIranIraqIrelandIsraelItalyJamaicaJapanJordanKazakhstanKenyaKoreaKuwaitLaosLatin AmericaLatviaLebanonLiberiaLithuaniaMalaysiaMexicoMicronesiaMiddle AfricaMoldovaMoroccoNepalNetherlandsNicaraguaNigeriaNorth AmericaNorth MacedoniaNorthern AfricaNorthern EuropeNorwayOceaniaPakistanPanamaPeruPhilippinesPolandPortugalRomaniaRussiaSaudi ArabiaScotlandSenegalSerbiaSierra LeoneSingaporeSomaliaSouth AfricaSouth AmericaSouth Central AsiaSouth Eastern AsiaSouthern EuropeSpainSri LankaSt. Vincent and the GrenadinesSudanSwedenSwitzerlandSyriaTaiwanThailandTrinidad and TobagoTurkeyUgandaUkraineUruguayUzbekistanVenezuelaVietnamWest IndiesWestern AfricaWestern AsiaWestern EuropeYemenZaireZimbabweAzores
Female Poverty
Income
Poverty
Unemployment
Labor Participation
Family Structure
Vehicle Availability
Education Level
Disability

Female Poverty Comparison

New Zealanders

Blackfeet

Exceptional
Tragic
12.7%
FEMALE POVERTY
90.6/ 100
METRIC RATING
120th/ 347
METRIC RANK
16.4%
FEMALE POVERTY
0.0/ 100
METRIC RATING
289th/ 347
METRIC RANK

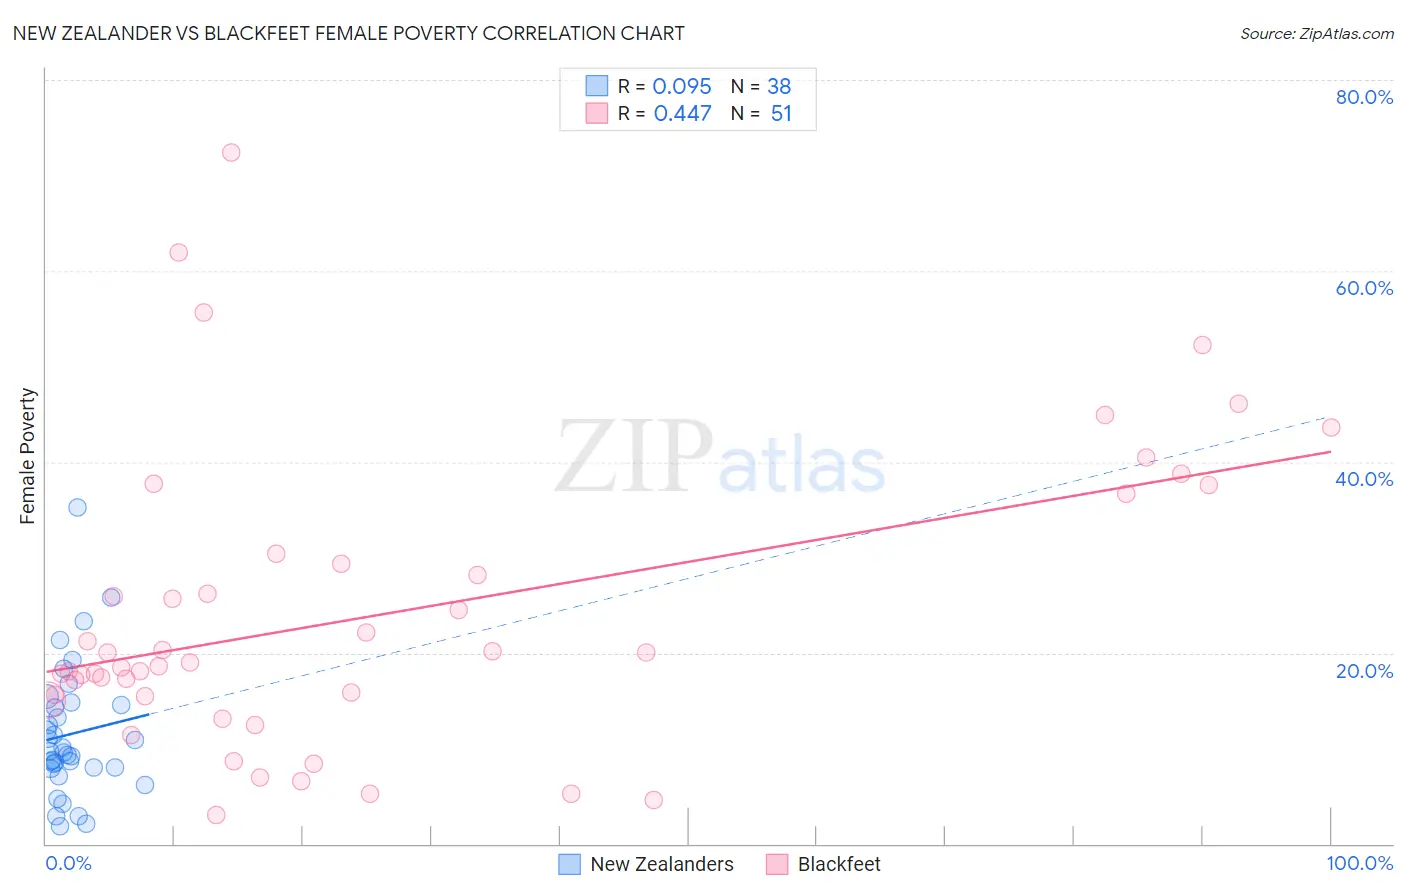
New Zealander vs Blackfeet Female Poverty Correlation Chart

The statistical analysis conducted on geographies consisting of 106,893,684 people shows a slight positive correlation between the proportion of New Zealanders and poverty level among females in the United States with a correlation coefficient (R) of 0.095 and weighted average of 12.7%. Similarly, the statistical analysis conducted on geographies consisting of 309,450,114 people shows a moderate positive correlation between the proportion of Blackfeet and poverty level among females in the United States with a correlation coefficient (R) of 0.447 and weighted average of 16.4%, a difference of 28.8%.
New Zealander vs Blackfeet Female Poverty

Female Poverty Correlation Summary

MeasurementNew ZealanderBlackfeet
Minimum1.9%3.0%
Maximum35.3%72.4%
Range33.4%69.4%
Mean11.5%24.1%
Median9.6%19.0%
Interquartile 25% (IQ1)8.0%15.5%
Interquartile 75% (IQ3)14.5%30.4%
Interquartile Range (IQR)6.5%14.9%
Standard Deviation (Sample)6.9%15.4%
Standard Deviation (Population)6.8%15.2%

Similar Demographics by Female Poverty

Demographics Similar to New Zealanders by Female Poverty

In terms of female poverty, the demographic groups most similar to New Zealanders are Albanian (12.7%, a difference of 0.060%), Sri Lankan (12.7%, a difference of 0.070%), Immigrants from Southern Europe (12.7%, a difference of 0.090%), Immigrants from Hungary (12.7%, a difference of 0.10%), and French Canadian (12.7%, a difference of 0.14%).
DemographicsRating | RankFemale Poverty
Canadians
92.0
/100
|
#113
Exceptional
12.7%
Welsh
91.6
/100
|
#114
Exceptional
12.7%
Puget Sound Salish
91.5
/100
|
#115
Exceptional
12.7%
Immigrants | Russia
91.2
/100
|
#116
Exceptional
12.7%
Immigrants | Southern Europe
90.9
/100
|
#117
Exceptional
12.7%
Sri Lankans
90.9
/100
|
#118
Exceptional
12.7%
Albanians
90.8
/100
|
#119
Exceptional
12.7%
New Zealanders
90.6
/100
|
#120
Exceptional
12.7%
Immigrants | Hungary
90.3
/100
|
#121
Exceptional
12.7%
French Canadians
90.2
/100
|
#122
Exceptional
12.7%
Immigrants | South Eastern Asia
89.9
/100
|
#123
Excellent
12.7%
Immigrants | Norway
89.3
/100
|
#124
Excellent
12.8%
Argentineans
89.1
/100
|
#125
Excellent
12.8%
Immigrants | Ukraine
88.8
/100
|
#126
Excellent
12.8%
South Africans
88.4
/100
|
#127
Excellent
12.8%

Demographics Similar to Blackfeet by Female Poverty

In terms of female poverty, the demographic groups most similar to Blackfeet are Indonesian (16.4%, a difference of 0.010%), Immigrants from Bangladesh (16.4%, a difference of 0.19%), Yaqui (16.4%, a difference of 0.36%), Immigrants from Zaire (16.4%, a difference of 0.37%), and Immigrants from Latin America (16.4%, a difference of 0.42%).
DemographicsRating | RankFemale Poverty
Immigrants | Haiti
0.0
/100
|
#282
Tragic
16.1%
Immigrants | Cuba
0.0
/100
|
#283
Tragic
16.1%
Spanish Americans
0.0
/100
|
#284
Tragic
16.2%
Comanche
0.0
/100
|
#285
Tragic
16.2%
Inupiat
0.0
/100
|
#286
Tragic
16.2%
Immigrants | Belize
0.0
/100
|
#287
Tragic
16.3%
Indonesians
0.0
/100
|
#288
Tragic
16.4%
Blackfeet
0.0
/100
|
#289
Tragic
16.4%
Immigrants | Bangladesh
0.0
/100
|
#290
Tragic
16.4%
Yaqui
0.0
/100
|
#291
Tragic
16.4%
Immigrants | Zaire
0.0
/100
|
#292
Tragic
16.4%
Immigrants | Latin America
0.0
/100
|
#293
Tragic
16.4%
Immigrants | Cabo Verde
0.0
/100
|
#294
Tragic
16.4%
Senegalese
0.0
/100
|
#295
Tragic
16.5%
Immigrants | Senegal
0.0
/100
|
#296
Tragic
16.5%