Nepalese vs Immigrants from Liberia Female Poverty
COMPARE
Nepalese
Immigrants from Liberia
Female Poverty
Female Poverty Comparison
Nepalese
Immigrants from Liberia
15.2%
FEMALE POVERTY
0.4/ 100
METRIC RATING
242nd/ 347
METRIC RANK
15.7%
FEMALE POVERTY
0.1/ 100
METRIC RATING
265th/ 347
METRIC RANK
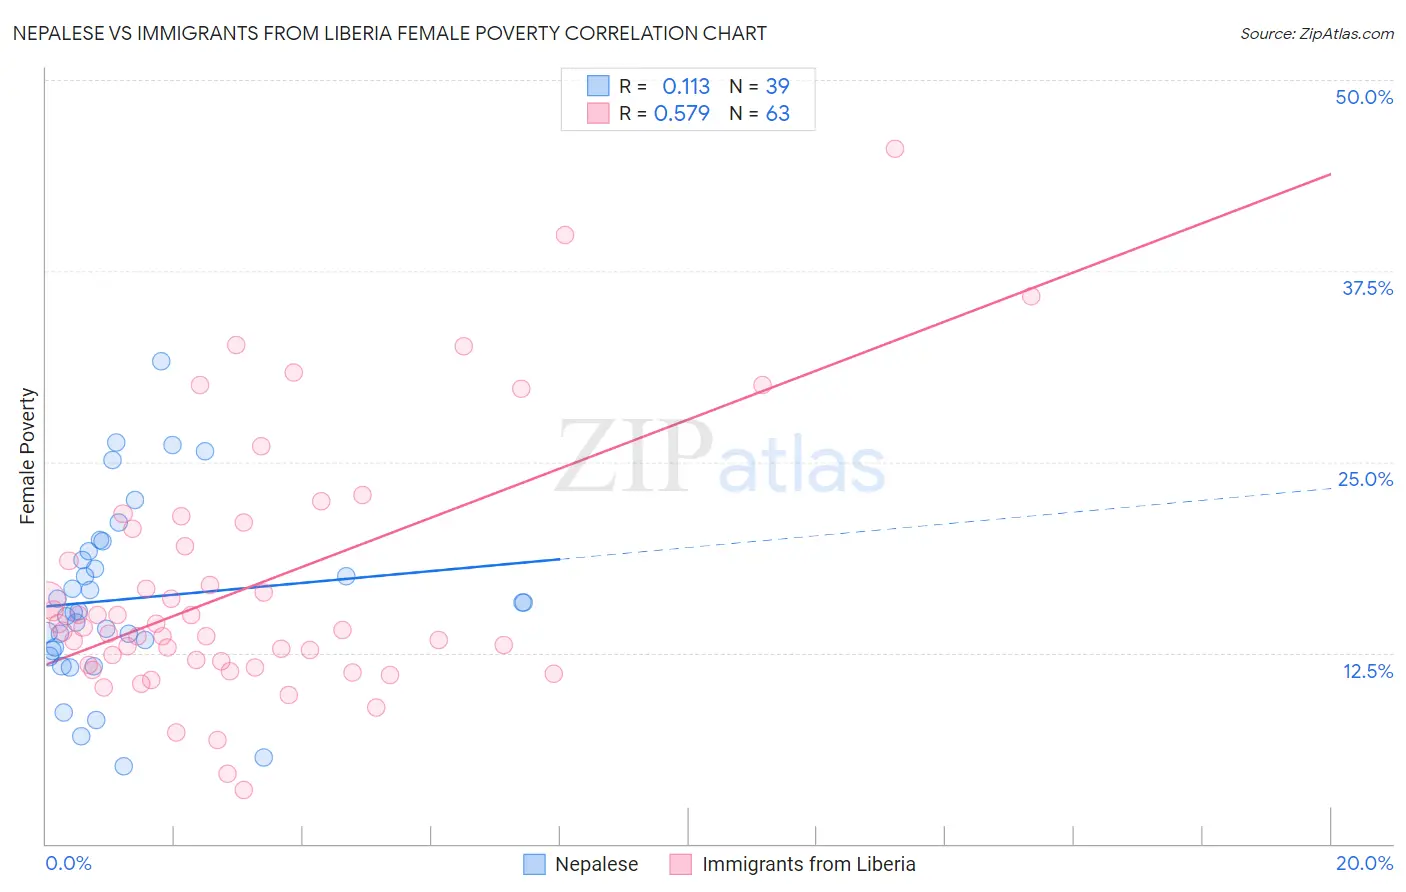
Nepalese vs Immigrants from Liberia Female Poverty Correlation Chart
The statistical analysis conducted on geographies consisting of 24,519,269 people shows a poor positive correlation between the proportion of Nepalese and poverty level among females in the United States with a correlation coefficient (R) of 0.113 and weighted average of 15.2%. Similarly, the statistical analysis conducted on geographies consisting of 135,246,592 people shows a substantial positive correlation between the proportion of Immigrants from Liberia and poverty level among females in the United States with a correlation coefficient (R) of 0.579 and weighted average of 15.7%, a difference of 2.9%.
Female Poverty Correlation Summary
| Measurement | Nepalese | Immigrants from Liberia |
| Minimum | 5.1% | 3.5% |
| Maximum | 31.6% | 45.5% |
| Range | 26.5% | 42.0% |
| Mean | 16.0% | 16.9% |
| Median | 15.3% | 14.0% |
| Interquartile 25% (IQ1) | 12.6% | 11.7% |
| Interquartile 75% (IQ3) | 19.2% | 20.6% |
| Interquartile Range (IQR) | 6.5% | 8.9% |
| Standard Deviation (Sample) | 5.8% | 8.4% |
| Standard Deviation (Population) | 5.8% | 8.3% |
Similar Demographics by Female Poverty
Demographics Similar to Nepalese by Female Poverty
In terms of female poverty, the demographic groups most similar to Nepalese are Immigrants from Sudan (15.2%, a difference of 0.12%), Nicaraguan (15.3%, a difference of 0.24%), Ecuadorian (15.3%, a difference of 0.29%), Sudanese (15.2%, a difference of 0.37%), and Spanish American Indian (15.3%, a difference of 0.39%).
| Demographics | Rating | Rank | Female Poverty |
| Immigrants | Laos | 0.9 /100 | #235 | Tragic 15.0% |
| Cree | 0.7 /100 | #236 | Tragic 15.1% |
| French American Indians | 0.6 /100 | #237 | Tragic 15.1% |
| Immigrants | Armenia | 0.6 /100 | #238 | Tragic 15.1% |
| Immigrants | Middle Africa | 0.5 /100 | #239 | Tragic 15.2% |
| Sudanese | 0.5 /100 | #240 | Tragic 15.2% |
| Immigrants | Sudan | 0.4 /100 | #241 | Tragic 15.2% |
| Nepalese | 0.4 /100 | #242 | Tragic 15.2% |
| Nicaraguans | 0.3 /100 | #243 | Tragic 15.3% |
| Ecuadorians | 0.3 /100 | #244 | Tragic 15.3% |
| Spanish American Indians | 0.3 /100 | #245 | Tragic 15.3% |
| Cubans | 0.3 /100 | #246 | Tragic 15.3% |
| Potawatomi | 0.3 /100 | #247 | Tragic 15.3% |
| Immigrants | Ghana | 0.3 /100 | #248 | Tragic 15.3% |
| Salvadorans | 0.3 /100 | #249 | Tragic 15.3% |
Demographics Similar to Immigrants from Liberia by Female Poverty
In terms of female poverty, the demographic groups most similar to Immigrants from Liberia are Immigrants from El Salvador (15.7%, a difference of 0.060%), Immigrants from Ecuador (15.6%, a difference of 0.30%), Cherokee (15.6%, a difference of 0.42%), Mexican American Indian (15.6%, a difference of 0.43%), and Guyanese (15.6%, a difference of 0.44%).
| Demographics | Rating | Rank | Female Poverty |
| Shoshone | 0.1 /100 | #258 | Tragic 15.6% |
| Cape Verdeans | 0.1 /100 | #259 | Tragic 15.6% |
| Immigrants | Guyana | 0.1 /100 | #260 | Tragic 15.6% |
| Guyanese | 0.1 /100 | #261 | Tragic 15.6% |
| Mexican American Indians | 0.1 /100 | #262 | Tragic 15.6% |
| Cherokee | 0.1 /100 | #263 | Tragic 15.6% |
| Immigrants | Ecuador | 0.1 /100 | #264 | Tragic 15.6% |
| Immigrants | Liberia | 0.1 /100 | #265 | Tragic 15.7% |
| Immigrants | El Salvador | 0.1 /100 | #266 | Tragic 15.7% |
| Sub-Saharan Africans | 0.1 /100 | #267 | Tragic 15.8% |
| Immigrants | Nicaragua | 0.1 /100 | #268 | Tragic 15.8% |
| Iroquois | 0.1 /100 | #269 | Tragic 15.8% |
| Chickasaw | 0.1 /100 | #270 | Tragic 15.9% |
| Immigrants | St. Vincent and the Grenadines | 0.0 /100 | #271 | Tragic 15.9% |
| Belizeans | 0.0 /100 | #272 | Tragic 15.9% |