Nepalese vs Immigrants from Belize Female Poverty
COMPARE
Nepalese
Immigrants from Belize
Female Poverty
Female Poverty Comparison
Nepalese
Immigrants from Belize
15.2%
FEMALE POVERTY
0.4/ 100
METRIC RATING
242nd/ 347
METRIC RANK
16.3%
FEMALE POVERTY
0.0/ 100
METRIC RATING
287th/ 347
METRIC RANK
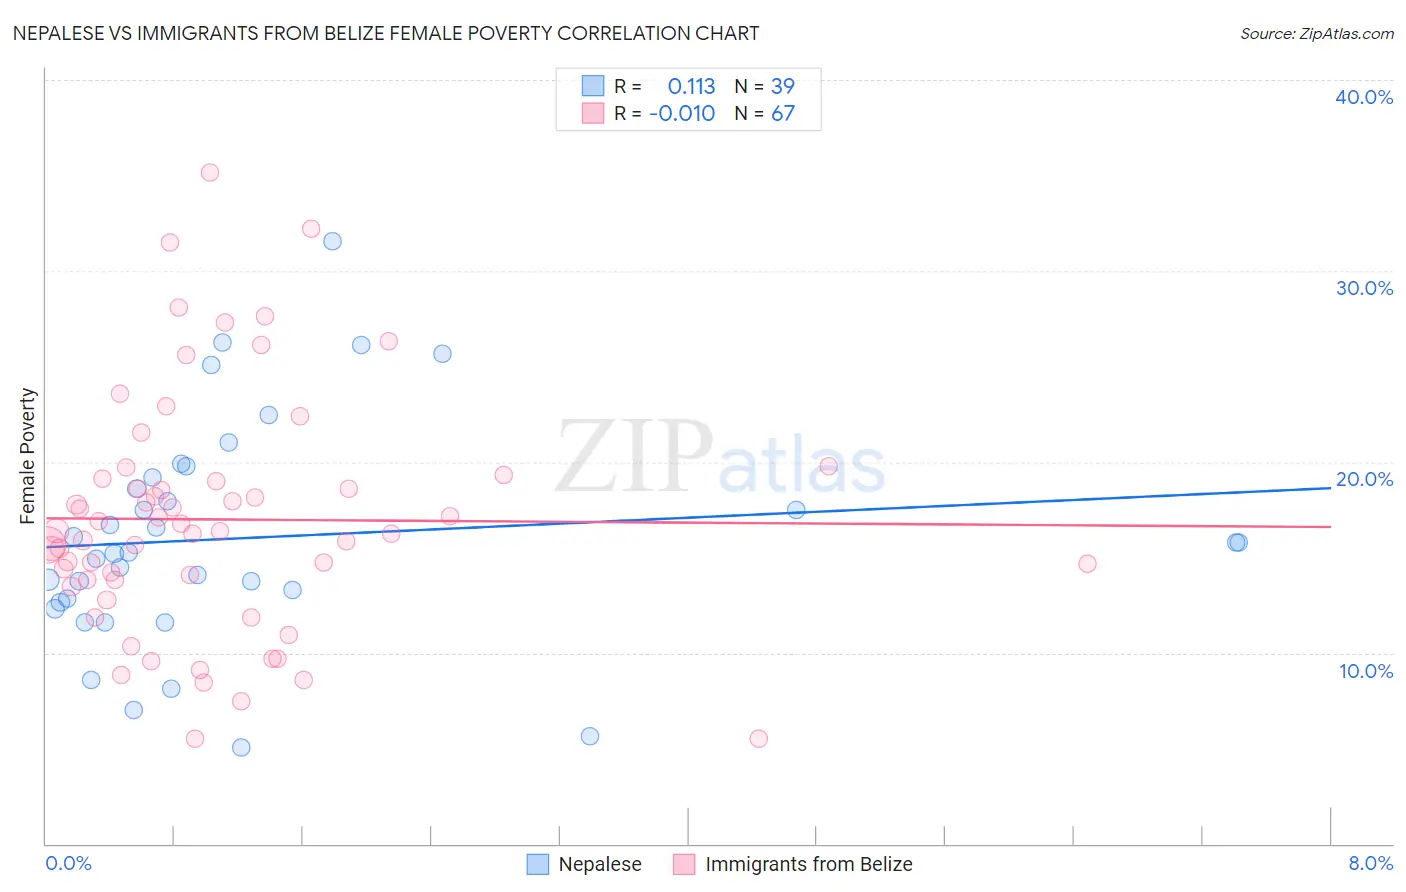
Nepalese vs Immigrants from Belize Female Poverty Correlation Chart
The statistical analysis conducted on geographies consisting of 24,519,269 people shows a poor positive correlation between the proportion of Nepalese and poverty level among females in the United States with a correlation coefficient (R) of 0.113 and weighted average of 15.2%. Similarly, the statistical analysis conducted on geographies consisting of 130,293,638 people shows no correlation between the proportion of Immigrants from Belize and poverty level among females in the United States with a correlation coefficient (R) of -0.010 and weighted average of 16.3%, a difference of 6.8%.
Female Poverty Correlation Summary
| Measurement | Nepalese | Immigrants from Belize |
| Minimum | 5.1% | 5.5% |
| Maximum | 31.6% | 35.2% |
| Range | 26.5% | 29.7% |
| Mean | 16.0% | 17.0% |
| Median | 15.3% | 16.3% |
| Interquartile 25% (IQ1) | 12.6% | 13.8% |
| Interquartile 75% (IQ3) | 19.2% | 19.1% |
| Interquartile Range (IQR) | 6.5% | 5.3% |
| Standard Deviation (Sample) | 5.8% | 6.2% |
| Standard Deviation (Population) | 5.8% | 6.2% |
Similar Demographics by Female Poverty
Demographics Similar to Nepalese by Female Poverty
In terms of female poverty, the demographic groups most similar to Nepalese are Immigrants from Sudan (15.2%, a difference of 0.12%), Nicaraguan (15.3%, a difference of 0.24%), Ecuadorian (15.3%, a difference of 0.29%), Sudanese (15.2%, a difference of 0.37%), and Spanish American Indian (15.3%, a difference of 0.39%).
| Demographics | Rating | Rank | Female Poverty |
| Immigrants | Laos | 0.9 /100 | #235 | Tragic 15.0% |
| Cree | 0.7 /100 | #236 | Tragic 15.1% |
| French American Indians | 0.6 /100 | #237 | Tragic 15.1% |
| Immigrants | Armenia | 0.6 /100 | #238 | Tragic 15.1% |
| Immigrants | Middle Africa | 0.5 /100 | #239 | Tragic 15.2% |
| Sudanese | 0.5 /100 | #240 | Tragic 15.2% |
| Immigrants | Sudan | 0.4 /100 | #241 | Tragic 15.2% |
| Nepalese | 0.4 /100 | #242 | Tragic 15.2% |
| Nicaraguans | 0.3 /100 | #243 | Tragic 15.3% |
| Ecuadorians | 0.3 /100 | #244 | Tragic 15.3% |
| Spanish American Indians | 0.3 /100 | #245 | Tragic 15.3% |
| Cubans | 0.3 /100 | #246 | Tragic 15.3% |
| Potawatomi | 0.3 /100 | #247 | Tragic 15.3% |
| Immigrants | Ghana | 0.3 /100 | #248 | Tragic 15.3% |
| Salvadorans | 0.3 /100 | #249 | Tragic 15.3% |
Demographics Similar to Immigrants from Belize by Female Poverty
In terms of female poverty, the demographic groups most similar to Immigrants from Belize are Inupiat (16.2%, a difference of 0.19%), Indonesian (16.4%, a difference of 0.55%), Blackfeet (16.4%, a difference of 0.56%), Comanche (16.2%, a difference of 0.63%), and Spanish American (16.2%, a difference of 0.71%).
| Demographics | Rating | Rank | Female Poverty |
| Vietnamese | 0.0 /100 | #280 | Tragic 16.1% |
| West Indians | 0.0 /100 | #281 | Tragic 16.1% |
| Immigrants | Haiti | 0.0 /100 | #282 | Tragic 16.1% |
| Immigrants | Cuba | 0.0 /100 | #283 | Tragic 16.1% |
| Spanish Americans | 0.0 /100 | #284 | Tragic 16.2% |
| Comanche | 0.0 /100 | #285 | Tragic 16.2% |
| Inupiat | 0.0 /100 | #286 | Tragic 16.2% |
| Immigrants | Belize | 0.0 /100 | #287 | Tragic 16.3% |
| Indonesians | 0.0 /100 | #288 | Tragic 16.4% |
| Blackfeet | 0.0 /100 | #289 | Tragic 16.4% |
| Immigrants | Bangladesh | 0.0 /100 | #290 | Tragic 16.4% |
| Yaqui | 0.0 /100 | #291 | Tragic 16.4% |
| Immigrants | Zaire | 0.0 /100 | #292 | Tragic 16.4% |
| Immigrants | Latin America | 0.0 /100 | #293 | Tragic 16.4% |
| Immigrants | Cabo Verde | 0.0 /100 | #294 | Tragic 16.4% |