Nepalese vs Immigrants from Belize Median Household Income
COMPARE
Nepalese
Immigrants from Belize
Median Household Income
Median Household Income Comparison
Nepalese
Immigrants from Belize
$82,410
MEDIAN HOUSEHOLD INCOME
15.1/ 100
METRIC RATING
213th/ 347
METRIC RANK
$75,938
MEDIAN HOUSEHOLD INCOME
0.3/ 100
METRIC RATING
265th/ 347
METRIC RANK
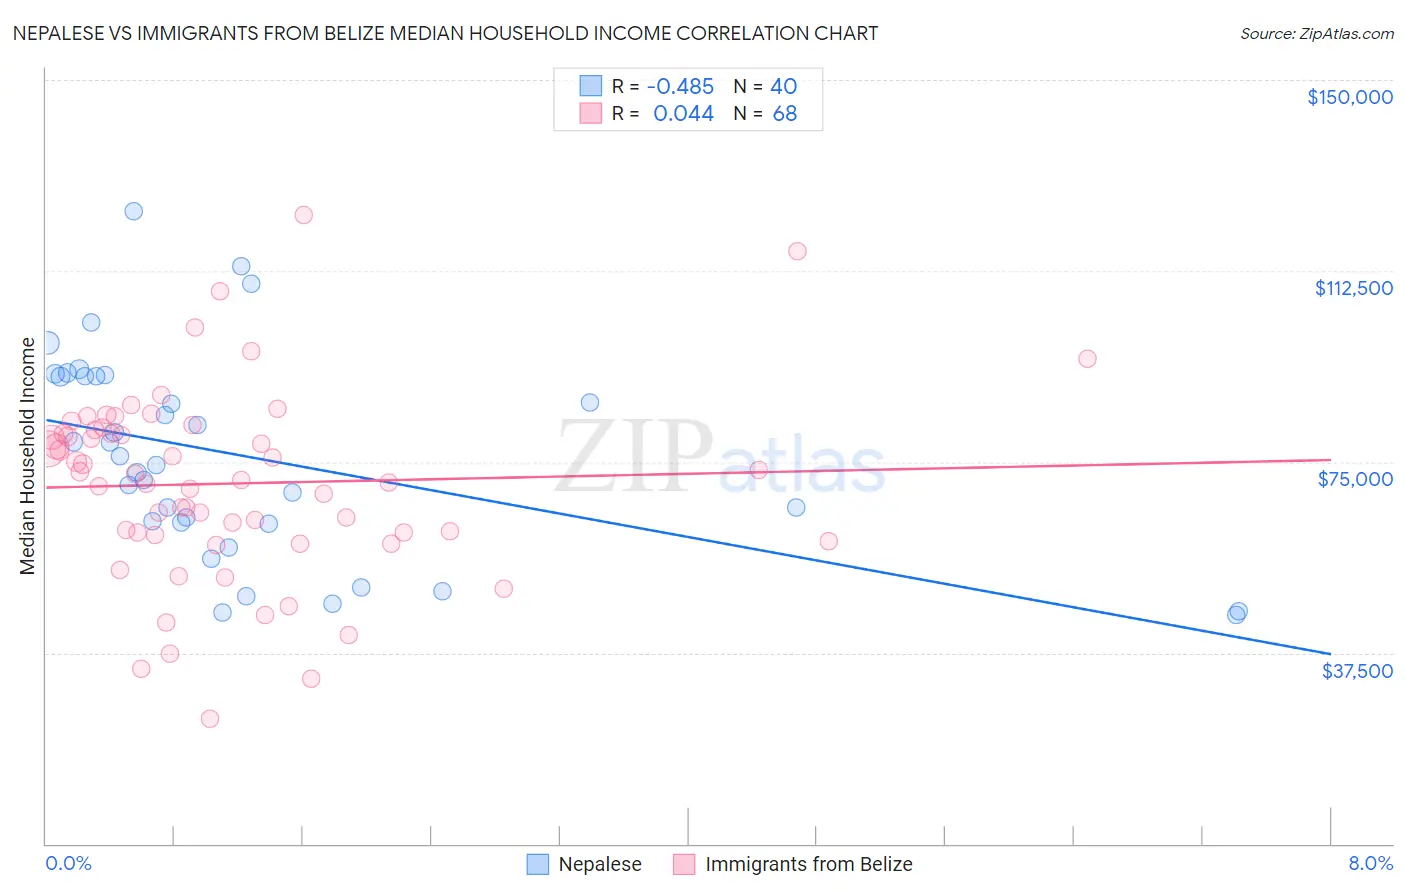
Nepalese vs Immigrants from Belize Median Household Income Correlation Chart
The statistical analysis conducted on geographies consisting of 24,521,755 people shows a moderate negative correlation between the proportion of Nepalese and median household income in the United States with a correlation coefficient (R) of -0.485 and weighted average of $82,410. Similarly, the statistical analysis conducted on geographies consisting of 130,279,222 people shows no correlation between the proportion of Immigrants from Belize and median household income in the United States with a correlation coefficient (R) of 0.044 and weighted average of $75,938, a difference of 8.5%.
Median Household Income Correlation Summary
| Measurement | Nepalese | Immigrants from Belize |
| Minimum | $45,000 | $24,491 |
| Maximum | $124,273 | $123,457 |
| Range | $79,273 | $98,966 |
| Mean | $75,935 | $70,734 |
| Median | $75,316 | $72,073 |
| Interquartile 25% (IQ1) | $63,001 | $60,781 |
| Interquartile 75% (IQ3) | $91,848 | $80,909 |
| Interquartile Range (IQR) | $28,847 | $20,129 |
| Standard Deviation (Sample) | $20,077 | $18,493 |
| Standard Deviation (Population) | $19,825 | $18,357 |
Similar Demographics by Median Household Income
Demographics Similar to Nepalese by Median Household Income
In terms of median household income, the demographic groups most similar to Nepalese are Venezuelan ($82,432, a difference of 0.030%), Salvadoran ($82,449, a difference of 0.050%), Panamanian ($82,272, a difference of 0.17%), Immigrants from Uruguay ($82,560, a difference of 0.18%), and Vietnamese ($82,248, a difference of 0.20%).
| Demographics | Rating | Rank | Median Household Income |
| Immigrants | Kenya | 21.3 /100 | #206 | Fair $83,068 |
| Dutch | 20.3 /100 | #207 | Fair $82,971 |
| French Canadians | 18.7 /100 | #208 | Poor $82,810 |
| Immigrants | Iraq | 16.7 /100 | #209 | Poor $82,594 |
| Immigrants | Uruguay | 16.4 /100 | #210 | Poor $82,560 |
| Salvadorans | 15.4 /100 | #211 | Poor $82,449 |
| Venezuelans | 15.3 /100 | #212 | Poor $82,432 |
| Nepalese | 15.1 /100 | #213 | Poor $82,410 |
| Panamanians | 14.0 /100 | #214 | Poor $82,272 |
| Vietnamese | 13.8 /100 | #215 | Poor $82,248 |
| Yugoslavians | 13.3 /100 | #216 | Poor $82,186 |
| Ecuadorians | 12.5 /100 | #217 | Poor $82,070 |
| Whites/Caucasians | 12.2 /100 | #218 | Poor $82,029 |
| Nigerians | 10.3 /100 | #219 | Poor $81,725 |
| Immigrants | Venezuela | 9.0 /100 | #220 | Tragic $81,506 |
Demographics Similar to Immigrants from Belize by Median Household Income
In terms of median household income, the demographic groups most similar to Immigrants from Belize are American ($75,932, a difference of 0.010%), Guatemalan ($75,961, a difference of 0.030%), German Russian ($75,856, a difference of 0.11%), Immigrants from Jamaica ($75,851, a difference of 0.11%), and Cape Verdean ($75,848, a difference of 0.12%).
| Demographics | Rating | Rank | Median Household Income |
| Immigrants | Nicaragua | 0.5 /100 | #258 | Tragic $76,784 |
| Spanish American Indians | 0.4 /100 | #259 | Tragic $76,670 |
| Jamaicans | 0.4 /100 | #260 | Tragic $76,583 |
| Immigrants | Grenada | 0.4 /100 | #261 | Tragic $76,517 |
| French American Indians | 0.4 /100 | #262 | Tragic $76,387 |
| Alaskan Athabascans | 0.4 /100 | #263 | Tragic $76,383 |
| Guatemalans | 0.3 /100 | #264 | Tragic $75,961 |
| Immigrants | Belize | 0.3 /100 | #265 | Tragic $75,938 |
| Americans | 0.3 /100 | #266 | Tragic $75,932 |
| German Russians | 0.3 /100 | #267 | Tragic $75,856 |
| Immigrants | Jamaica | 0.3 /100 | #268 | Tragic $75,851 |
| Cape Verdeans | 0.3 /100 | #269 | Tragic $75,848 |
| Hmong | 0.3 /100 | #270 | Tragic $75,839 |
| Pennsylvania Germans | 0.3 /100 | #271 | Tragic $75,814 |
| Somalis | 0.3 /100 | #272 | Tragic $75,782 |