Menominee vs Immigrants from Pakistan Child Poverty Among Girls Under 16
COMPARE
Menominee
Immigrants from Pakistan
Child Poverty Among Girls Under 16
Child Poverty Among Girls Under 16 Comparison
Menominee
Immigrants from Pakistan
25.0%
CHILD POVERTY AMONG GIRLS UNDER 16
0.0/ 100
METRIC RATING
334th/ 347
METRIC RANK
14.2%
CHILD POVERTY AMONG GIRLS UNDER 16
99.1/ 100
METRIC RATING
51st/ 347
METRIC RANK
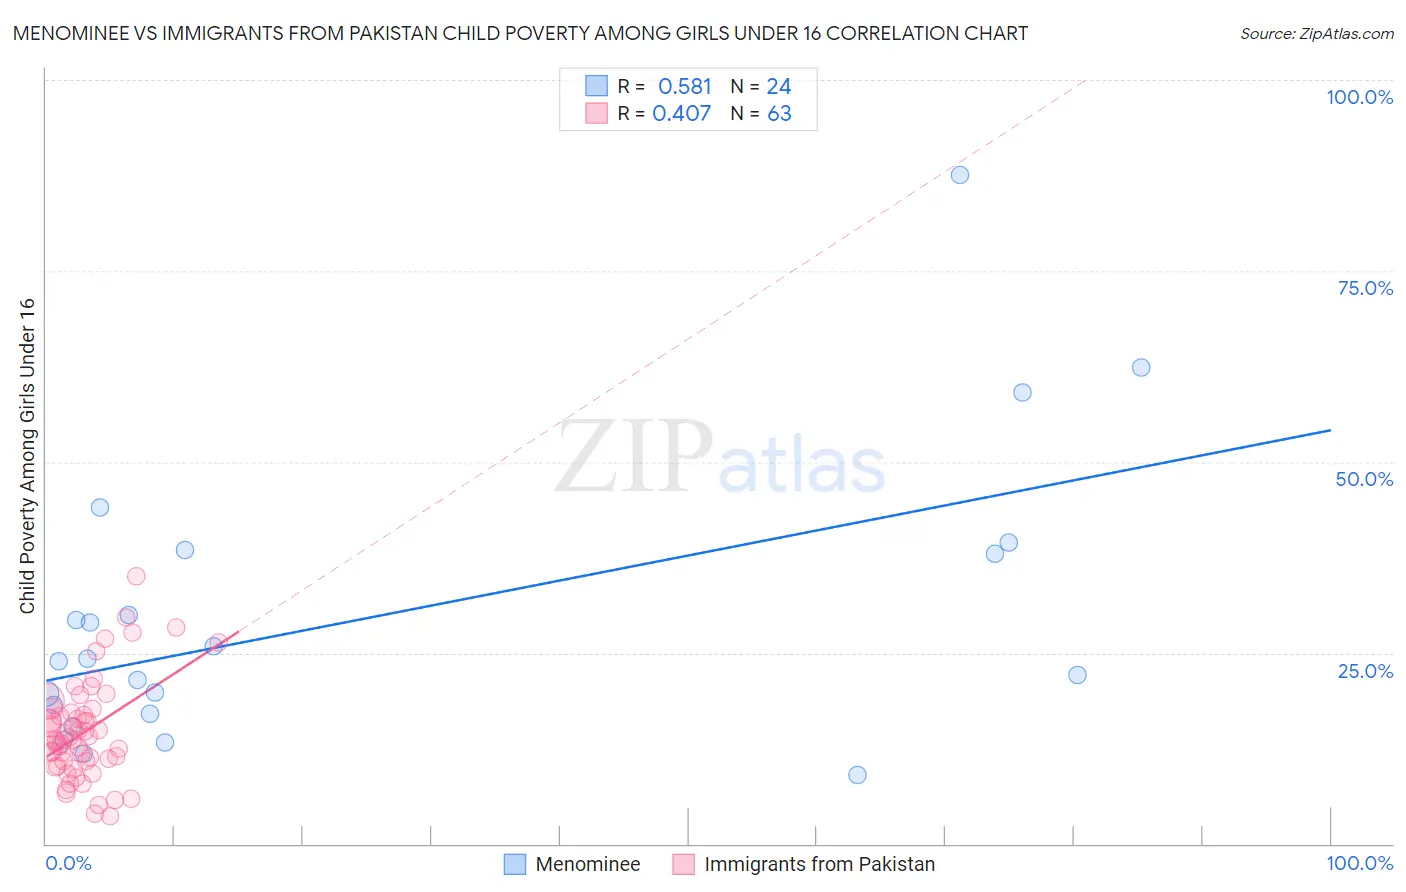
Menominee vs Immigrants from Pakistan Child Poverty Among Girls Under 16 Correlation Chart
The statistical analysis conducted on geographies consisting of 45,532,886 people shows a substantial positive correlation between the proportion of Menominee and poverty level among girls under the age of 16 in the United States with a correlation coefficient (R) of 0.581 and weighted average of 25.0%. Similarly, the statistical analysis conducted on geographies consisting of 280,243,418 people shows a moderate positive correlation between the proportion of Immigrants from Pakistan and poverty level among girls under the age of 16 in the United States with a correlation coefficient (R) of 0.407 and weighted average of 14.2%, a difference of 75.7%.
Child Poverty Among Girls Under 16 Correlation Summary
| Measurement | Menominee | Immigrants from Pakistan |
| Minimum | 9.0% | 3.6% |
| Maximum | 87.5% | 35.0% |
| Range | 78.5% | 31.4% |
| Mean | 29.7% | 14.6% |
| Median | 24.1% | 13.6% |
| Interquartile 25% (IQ1) | 17.6% | 10.8% |
| Interquartile 75% (IQ3) | 38.2% | 17.2% |
| Interquartile Range (IQR) | 20.6% | 6.3% |
| Standard Deviation (Sample) | 18.5% | 6.5% |
| Standard Deviation (Population) | 18.1% | 6.4% |
Similar Demographics by Child Poverty Among Girls Under 16
Demographics Similar to Menominee by Child Poverty Among Girls Under 16
In terms of child poverty among girls under 16, the demographic groups most similar to Menominee are Pueblo (25.2%, a difference of 0.70%), Black/African American (24.7%, a difference of 1.5%), Sioux (25.6%, a difference of 2.2%), Yup'ik (25.8%, a difference of 3.1%), and Native/Alaskan (24.0%, a difference of 4.1%).
| Demographics | Rating | Rank | Child Poverty Among Girls Under 16 |
| Central American Indians | 0.0 /100 | #327 | Tragic 22.8% |
| Dominicans | 0.0 /100 | #328 | Tragic 23.7% |
| Kiowa | 0.0 /100 | #329 | Tragic 23.7% |
| Immigrants | Dominican Republic | 0.0 /100 | #330 | Tragic 23.8% |
| Apache | 0.0 /100 | #331 | Tragic 23.8% |
| Natives/Alaskans | 0.0 /100 | #332 | Tragic 24.0% |
| Blacks/African Americans | 0.0 /100 | #333 | Tragic 24.7% |
| Menominee | 0.0 /100 | #334 | Tragic 25.0% |
| Pueblo | 0.0 /100 | #335 | Tragic 25.2% |
| Sioux | 0.0 /100 | #336 | Tragic 25.6% |
| Yup'ik | 0.0 /100 | #337 | Tragic 25.8% |
| Cheyenne | 0.0 /100 | #338 | Tragic 26.3% |
| Crow | 0.0 /100 | #339 | Tragic 26.4% |
| Yuman | 0.0 /100 | #340 | Tragic 27.1% |
| Hopi | 0.0 /100 | #341 | Tragic 27.9% |
Demographics Similar to Immigrants from Pakistan by Child Poverty Among Girls Under 16
In terms of child poverty among girls under 16, the demographic groups most similar to Immigrants from Pakistan are Italian (14.3%, a difference of 0.14%), Luxembourger (14.3%, a difference of 0.21%), Immigrants from Israel (14.2%, a difference of 0.55%), Greek (14.2%, a difference of 0.61%), and Estonian (14.3%, a difference of 0.64%).
| Demographics | Rating | Rank | Child Poverty Among Girls Under 16 |
| Immigrants | Asia | 99.4 /100 | #44 | Exceptional 14.1% |
| Immigrants | Greece | 99.3 /100 | #45 | Exceptional 14.1% |
| Croatians | 99.3 /100 | #46 | Exceptional 14.1% |
| Immigrants | Czechoslovakia | 99.3 /100 | #47 | Exceptional 14.2% |
| Czechs | 99.3 /100 | #48 | Exceptional 14.2% |
| Greeks | 99.2 /100 | #49 | Exceptional 14.2% |
| Immigrants | Israel | 99.2 /100 | #50 | Exceptional 14.2% |
| Immigrants | Pakistan | 99.1 /100 | #51 | Exceptional 14.2% |
| Italians | 99.1 /100 | #52 | Exceptional 14.3% |
| Luxembourgers | 99.0 /100 | #53 | Exceptional 14.3% |
| Estonians | 98.9 /100 | #54 | Exceptional 14.3% |
| Immigrants | Romania | 98.9 /100 | #55 | Exceptional 14.3% |
| Immigrants | Indonesia | 98.9 /100 | #56 | Exceptional 14.4% |
| Immigrants | Serbia | 98.9 /100 | #57 | Exceptional 14.4% |
| Immigrants | Bulgaria | 98.8 /100 | #58 | Exceptional 14.4% |