Immigrants from Uruguay vs Immigrants from Pakistan Child Poverty Among Girls Under 16
COMPARE
Immigrants from Uruguay
Immigrants from Pakistan
Child Poverty Among Girls Under 16
Child Poverty Among Girls Under 16 Comparison
Immigrants from Uruguay
Immigrants from Pakistan
16.7%
CHILD POVERTY AMONG GIRLS UNDER 16
35.6/ 100
METRIC RATING
185th/ 347
METRIC RANK
14.2%
CHILD POVERTY AMONG GIRLS UNDER 16
99.1/ 100
METRIC RATING
51st/ 347
METRIC RANK
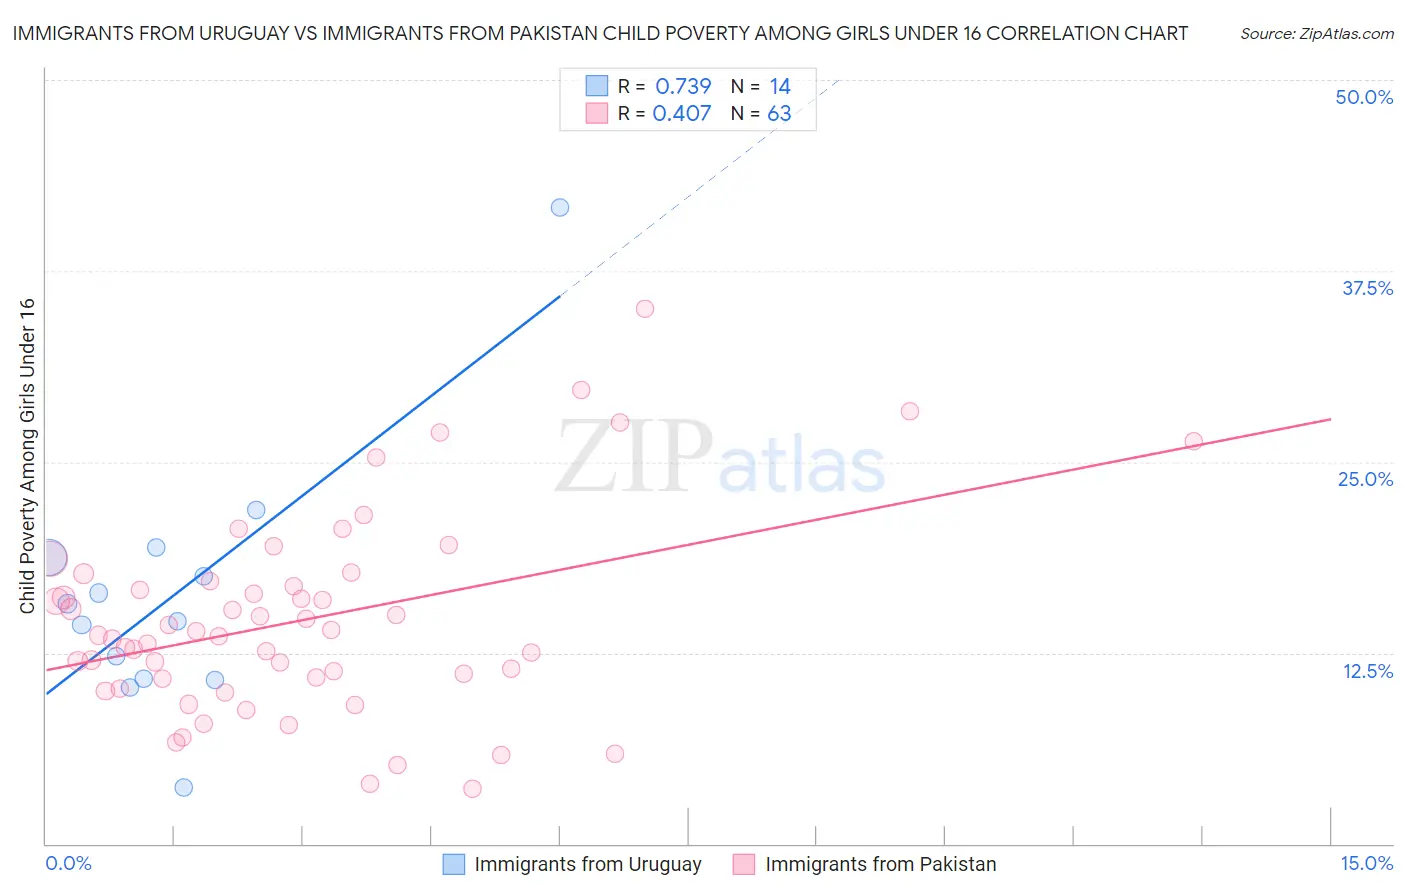
Immigrants from Uruguay vs Immigrants from Pakistan Child Poverty Among Girls Under 16 Correlation Chart
The statistical analysis conducted on geographies consisting of 132,453,644 people shows a strong positive correlation between the proportion of Immigrants from Uruguay and poverty level among girls under the age of 16 in the United States with a correlation coefficient (R) of 0.739 and weighted average of 16.7%. Similarly, the statistical analysis conducted on geographies consisting of 280,243,418 people shows a moderate positive correlation between the proportion of Immigrants from Pakistan and poverty level among girls under the age of 16 in the United States with a correlation coefficient (R) of 0.407 and weighted average of 14.2%, a difference of 17.6%.
Child Poverty Among Girls Under 16 Correlation Summary
| Measurement | Immigrants from Uruguay | Immigrants from Pakistan |
| Minimum | 3.7% | 3.6% |
| Maximum | 41.7% | 35.0% |
| Range | 38.0% | 31.4% |
| Mean | 16.3% | 14.6% |
| Median | 15.2% | 13.6% |
| Interquartile 25% (IQ1) | 10.8% | 10.8% |
| Interquartile 75% (IQ3) | 18.8% | 17.2% |
| Interquartile Range (IQR) | 7.9% | 6.3% |
| Standard Deviation (Sample) | 8.6% | 6.5% |
| Standard Deviation (Population) | 8.3% | 6.4% |
Similar Demographics by Child Poverty Among Girls Under 16
Demographics Similar to Immigrants from Uruguay by Child Poverty Among Girls Under 16
In terms of child poverty among girls under 16, the demographic groups most similar to Immigrants from Uruguay are South American Indian (16.8%, a difference of 0.070%), Immigrants from Morocco (16.8%, a difference of 0.13%), Arab (16.8%, a difference of 0.13%), Immigrants from Bosnia and Herzegovina (16.8%, a difference of 0.38%), and Kenyan (16.8%, a difference of 0.42%).
| Demographics | Rating | Rank | Child Poverty Among Girls Under 16 |
| Whites/Caucasians | 43.6 /100 | #178 | Average 16.6% |
| Hawaiians | 43.4 /100 | #179 | Average 16.6% |
| Immigrants | Syria | 43.3 /100 | #180 | Average 16.6% |
| Immigrants | Iraq | 43.2 /100 | #181 | Average 16.6% |
| Immigrants | Ethiopia | 43.1 /100 | #182 | Average 16.6% |
| Immigrants | Portugal | 42.5 /100 | #183 | Average 16.6% |
| Scotch-Irish | 39.6 /100 | #184 | Fair 16.7% |
| Immigrants | Uruguay | 35.6 /100 | #185 | Fair 16.7% |
| South American Indians | 35.0 /100 | #186 | Fair 16.8% |
| Immigrants | Morocco | 34.6 /100 | #187 | Fair 16.8% |
| Arabs | 34.5 /100 | #188 | Fair 16.8% |
| Immigrants | Bosnia and Herzegovina | 32.5 /100 | #189 | Fair 16.8% |
| Kenyans | 32.3 /100 | #190 | Fair 16.8% |
| Immigrants | Azores | 31.3 /100 | #191 | Fair 16.8% |
| Immigrants | Uganda | 31.3 /100 | #192 | Fair 16.8% |
Demographics Similar to Immigrants from Pakistan by Child Poverty Among Girls Under 16
In terms of child poverty among girls under 16, the demographic groups most similar to Immigrants from Pakistan are Italian (14.3%, a difference of 0.14%), Luxembourger (14.3%, a difference of 0.21%), Immigrants from Israel (14.2%, a difference of 0.55%), Greek (14.2%, a difference of 0.61%), and Estonian (14.3%, a difference of 0.64%).
| Demographics | Rating | Rank | Child Poverty Among Girls Under 16 |
| Immigrants | Asia | 99.4 /100 | #44 | Exceptional 14.1% |
| Immigrants | Greece | 99.3 /100 | #45 | Exceptional 14.1% |
| Croatians | 99.3 /100 | #46 | Exceptional 14.1% |
| Immigrants | Czechoslovakia | 99.3 /100 | #47 | Exceptional 14.2% |
| Czechs | 99.3 /100 | #48 | Exceptional 14.2% |
| Greeks | 99.2 /100 | #49 | Exceptional 14.2% |
| Immigrants | Israel | 99.2 /100 | #50 | Exceptional 14.2% |
| Immigrants | Pakistan | 99.1 /100 | #51 | Exceptional 14.2% |
| Italians | 99.1 /100 | #52 | Exceptional 14.3% |
| Luxembourgers | 99.0 /100 | #53 | Exceptional 14.3% |
| Estonians | 98.9 /100 | #54 | Exceptional 14.3% |
| Immigrants | Romania | 98.9 /100 | #55 | Exceptional 14.3% |
| Immigrants | Indonesia | 98.9 /100 | #56 | Exceptional 14.4% |
| Immigrants | Serbia | 98.9 /100 | #57 | Exceptional 14.4% |
| Immigrants | Bulgaria | 98.8 /100 | #58 | Exceptional 14.4% |