Immigrants from Kuwait vs Immigrants from Pakistan Child Poverty Among Girls Under 16
COMPARE
Immigrants from Kuwait
Immigrants from Pakistan
Child Poverty Among Girls Under 16
Child Poverty Among Girls Under 16 Comparison
Immigrants from Kuwait
Immigrants from Pakistan
15.8%
CHILD POVERTY AMONG GIRLS UNDER 16
79.4/ 100
METRIC RATING
152nd/ 347
METRIC RANK
14.2%
CHILD POVERTY AMONG GIRLS UNDER 16
99.1/ 100
METRIC RATING
51st/ 347
METRIC RANK
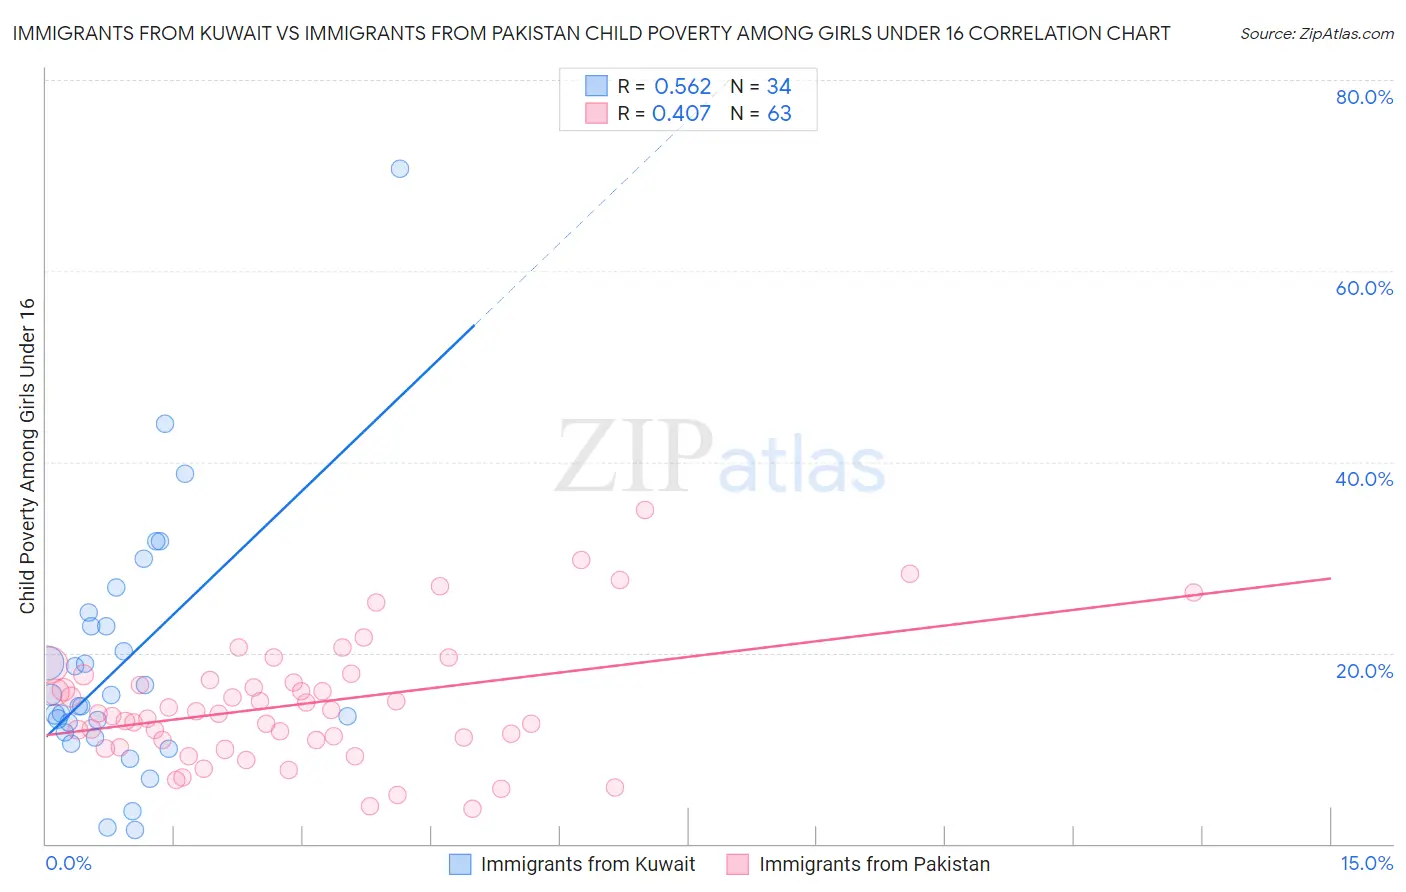
Immigrants from Kuwait vs Immigrants from Pakistan Child Poverty Among Girls Under 16 Correlation Chart
The statistical analysis conducted on geographies consisting of 136,192,954 people shows a substantial positive correlation between the proportion of Immigrants from Kuwait and poverty level among girls under the age of 16 in the United States with a correlation coefficient (R) of 0.562 and weighted average of 15.8%. Similarly, the statistical analysis conducted on geographies consisting of 280,243,418 people shows a moderate positive correlation between the proportion of Immigrants from Pakistan and poverty level among girls under the age of 16 in the United States with a correlation coefficient (R) of 0.407 and weighted average of 14.2%, a difference of 11.1%.
Child Poverty Among Girls Under 16 Correlation Summary
| Measurement | Immigrants from Kuwait | Immigrants from Pakistan |
| Minimum | 1.4% | 3.6% |
| Maximum | 70.8% | 35.0% |
| Range | 69.4% | 31.4% |
| Mean | 18.9% | 14.6% |
| Median | 15.0% | 13.6% |
| Interquartile 25% (IQ1) | 11.6% | 10.8% |
| Interquartile 75% (IQ3) | 22.8% | 17.2% |
| Interquartile Range (IQR) | 11.2% | 6.3% |
| Standard Deviation (Sample) | 13.4% | 6.5% |
| Standard Deviation (Population) | 13.2% | 6.4% |
Similar Demographics by Child Poverty Among Girls Under 16
Demographics Similar to Immigrants from Kuwait by Child Poverty Among Girls Under 16
In terms of child poverty among girls under 16, the demographic groups most similar to Immigrants from Kuwait are Venezuelan (15.8%, a difference of 0.14%), Immigrants from Nepal (15.9%, a difference of 0.15%), Immigrants from Albania (15.8%, a difference of 0.24%), Immigrants from Hungary (15.8%, a difference of 0.28%), and Immigrants from Chile (15.9%, a difference of 0.46%).
| Demographics | Rating | Rank | Child Poverty Among Girls Under 16 |
| Welsh | 85.4 /100 | #145 | Excellent 15.6% |
| Samoans | 84.2 /100 | #146 | Excellent 15.7% |
| Slavs | 83.1 /100 | #147 | Excellent 15.7% |
| Icelanders | 82.4 /100 | #148 | Excellent 15.7% |
| Immigrants | Hungary | 80.9 /100 | #149 | Excellent 15.8% |
| Immigrants | Albania | 80.7 /100 | #150 | Excellent 15.8% |
| Venezuelans | 80.1 /100 | #151 | Excellent 15.8% |
| Immigrants | Kuwait | 79.4 /100 | #152 | Good 15.8% |
| Immigrants | Nepal | 78.5 /100 | #153 | Good 15.9% |
| Immigrants | Chile | 76.7 /100 | #154 | Good 15.9% |
| Syrians | 76.7 /100 | #155 | Good 15.9% |
| Immigrants | Fiji | 76.1 /100 | #156 | Good 15.9% |
| Colombians | 76.1 /100 | #157 | Good 15.9% |
| Guamanians/Chamorros | 75.3 /100 | #158 | Good 15.9% |
| Slovaks | 75.2 /100 | #159 | Good 15.9% |
Demographics Similar to Immigrants from Pakistan by Child Poverty Among Girls Under 16
In terms of child poverty among girls under 16, the demographic groups most similar to Immigrants from Pakistan are Italian (14.3%, a difference of 0.14%), Luxembourger (14.3%, a difference of 0.21%), Immigrants from Israel (14.2%, a difference of 0.55%), Greek (14.2%, a difference of 0.61%), and Estonian (14.3%, a difference of 0.64%).
| Demographics | Rating | Rank | Child Poverty Among Girls Under 16 |
| Immigrants | Asia | 99.4 /100 | #44 | Exceptional 14.1% |
| Immigrants | Greece | 99.3 /100 | #45 | Exceptional 14.1% |
| Croatians | 99.3 /100 | #46 | Exceptional 14.1% |
| Immigrants | Czechoslovakia | 99.3 /100 | #47 | Exceptional 14.2% |
| Czechs | 99.3 /100 | #48 | Exceptional 14.2% |
| Greeks | 99.2 /100 | #49 | Exceptional 14.2% |
| Immigrants | Israel | 99.2 /100 | #50 | Exceptional 14.2% |
| Immigrants | Pakistan | 99.1 /100 | #51 | Exceptional 14.2% |
| Italians | 99.1 /100 | #52 | Exceptional 14.3% |
| Luxembourgers | 99.0 /100 | #53 | Exceptional 14.3% |
| Estonians | 98.9 /100 | #54 | Exceptional 14.3% |
| Immigrants | Romania | 98.9 /100 | #55 | Exceptional 14.3% |
| Immigrants | Indonesia | 98.9 /100 | #56 | Exceptional 14.4% |
| Immigrants | Serbia | 98.9 /100 | #57 | Exceptional 14.4% |
| Immigrants | Bulgaria | 98.8 /100 | #58 | Exceptional 14.4% |