Lithuanian vs Ugandan Female Poverty Among 18-24 Year Olds
COMPARE
Lithuanian
Ugandan
Female Poverty Among 18-24 Year Olds
Female Poverty Among 18-24 Year Olds Comparison
Lithuanians
Ugandans
18.7%
FEMALE POVERTY AMONG 18-24 YEAR OLDS
99.7/ 100
METRIC RATING
73rd/ 347
METRIC RANK
22.1%
FEMALE POVERTY AMONG 18-24 YEAR OLDS
0.0/ 100
METRIC RATING
286th/ 347
METRIC RANK
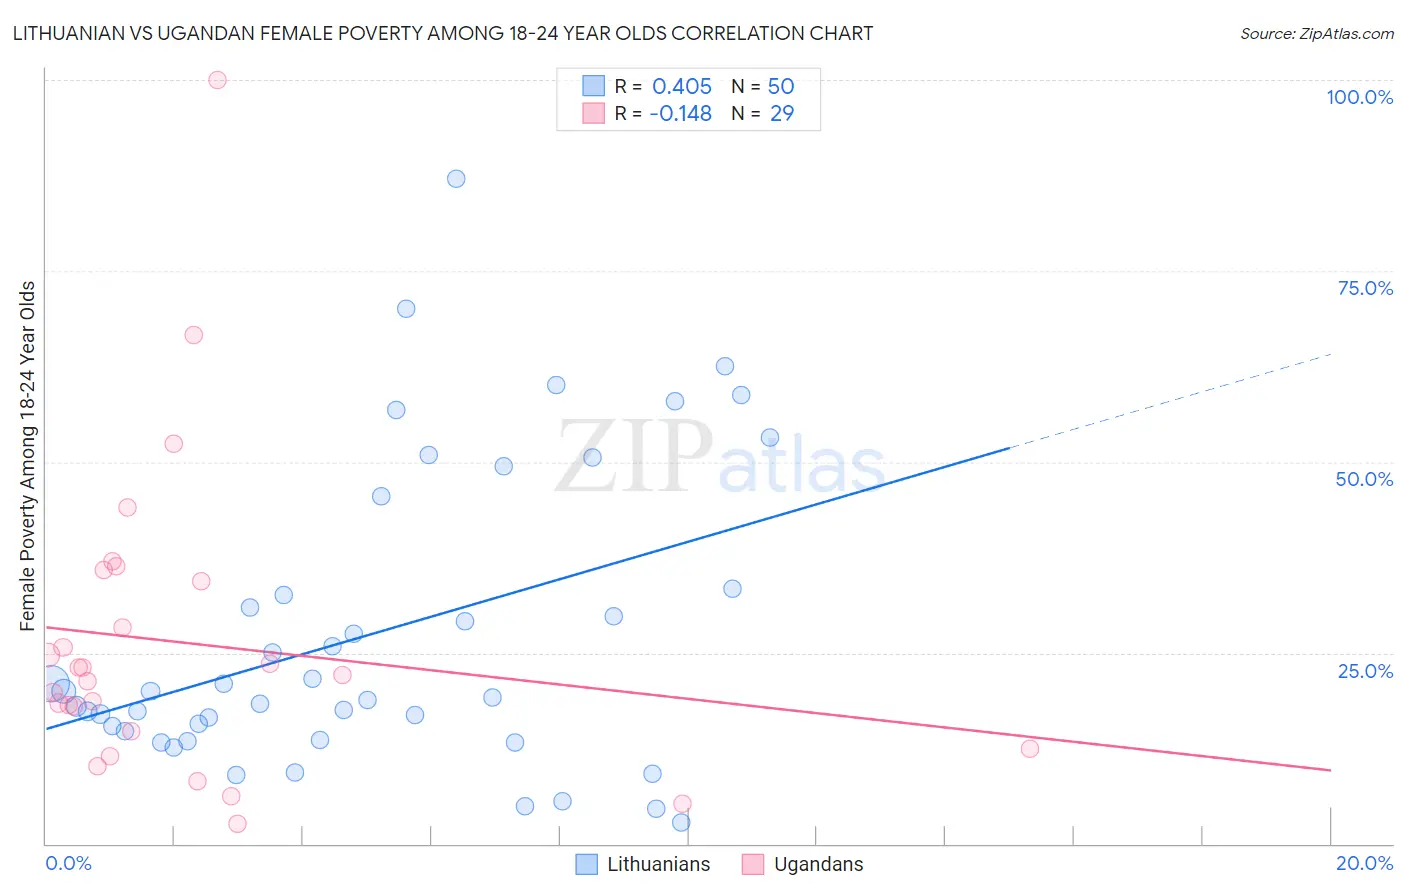
Lithuanian vs Ugandan Female Poverty Among 18-24 Year Olds Correlation Chart
The statistical analysis conducted on geographies consisting of 405,735,156 people shows a moderate positive correlation between the proportion of Lithuanians and poverty level among females between the ages 18 and 24 in the United States with a correlation coefficient (R) of 0.405 and weighted average of 18.7%. Similarly, the statistical analysis conducted on geographies consisting of 93,585,105 people shows a poor negative correlation between the proportion of Ugandans and poverty level among females between the ages 18 and 24 in the United States with a correlation coefficient (R) of -0.148 and weighted average of 22.1%, a difference of 18.1%.
Female Poverty Among 18-24 Year Olds Correlation Summary
| Measurement | Lithuanian | Ugandan |
| Minimum | 2.8% | 2.7% |
| Maximum | 87.0% | 100.0% |
| Range | 84.2% | 97.3% |
| Mean | 27.5% | 26.3% |
| Median | 19.6% | 22.0% |
| Interquartile 25% (IQ1) | 14.8% | 13.6% |
| Interquartile 75% (IQ3) | 33.3% | 35.1% |
| Interquartile Range (IQR) | 18.6% | 21.5% |
| Standard Deviation (Sample) | 19.6% | 20.1% |
| Standard Deviation (Population) | 19.4% | 19.8% |
Similar Demographics by Female Poverty Among 18-24 Year Olds
Demographics Similar to Lithuanians by Female Poverty Among 18-24 Year Olds
In terms of female poverty among 18-24 year olds, the demographic groups most similar to Lithuanians are Armenian (18.7%, a difference of 0.040%), Immigrants from Haiti (18.7%, a difference of 0.060%), Immigrants from Costa Rica (18.7%, a difference of 0.12%), Hawaiian (18.7%, a difference of 0.19%), and Immigrants from Bulgaria (18.6%, a difference of 0.23%).
| Demographics | Rating | Rank | Female Poverty Among 18-24 Year Olds |
| Jordanians | 99.8 /100 | #66 | Exceptional 18.6% |
| Immigrants | Korea | 99.8 /100 | #67 | Exceptional 18.6% |
| Brazilians | 99.8 /100 | #68 | Exceptional 18.6% |
| Immigrants | Bulgaria | 99.7 /100 | #69 | Exceptional 18.6% |
| Immigrants | Costa Rica | 99.7 /100 | #70 | Exceptional 18.7% |
| Immigrants | Haiti | 99.7 /100 | #71 | Exceptional 18.7% |
| Armenians | 99.7 /100 | #72 | Exceptional 18.7% |
| Lithuanians | 99.7 /100 | #73 | Exceptional 18.7% |
| Hawaiians | 99.6 /100 | #74 | Exceptional 18.7% |
| Poles | 99.6 /100 | #75 | Exceptional 18.8% |
| Immigrants | Cambodia | 99.5 /100 | #76 | Exceptional 18.8% |
| Costa Ricans | 99.5 /100 | #77 | Exceptional 18.8% |
| Immigrants | Europe | 99.5 /100 | #78 | Exceptional 18.8% |
| Uruguayans | 99.5 /100 | #79 | Exceptional 18.8% |
| Palestinians | 99.5 /100 | #80 | Exceptional 18.8% |
Demographics Similar to Ugandans by Female Poverty Among 18-24 Year Olds
In terms of female poverty among 18-24 year olds, the demographic groups most similar to Ugandans are Immigrants from Middle Africa (22.1%, a difference of 0.010%), Ottawa (22.0%, a difference of 0.19%), Tlingit-Haida (22.0%, a difference of 0.31%), Subsaharan African (22.0%, a difference of 0.32%), and Bermudan (21.9%, a difference of 0.62%).
| Demographics | Rating | Rank | Female Poverty Among 18-24 Year Olds |
| Spanish Americans | 0.1 /100 | #279 | Tragic 21.9% |
| Immigrants | Dominica | 0.1 /100 | #280 | Tragic 21.9% |
| Immigrants | Dominican Republic | 0.1 /100 | #281 | Tragic 21.9% |
| Bermudans | 0.1 /100 | #282 | Tragic 21.9% |
| Sub-Saharan Africans | 0.0 /100 | #283 | Tragic 22.0% |
| Tlingit-Haida | 0.0 /100 | #284 | Tragic 22.0% |
| Ottawa | 0.0 /100 | #285 | Tragic 22.0% |
| Ugandans | 0.0 /100 | #286 | Tragic 22.1% |
| Immigrants | Middle Africa | 0.0 /100 | #287 | Tragic 22.1% |
| Dominicans | 0.0 /100 | #288 | Tragic 22.3% |
| French American Indians | 0.0 /100 | #289 | Tragic 22.3% |
| Immigrants | Senegal | 0.0 /100 | #290 | Tragic 22.4% |
| Bangladeshis | 0.0 /100 | #291 | Tragic 22.5% |
| Alaskan Athabascans | 0.0 /100 | #292 | Tragic 22.5% |
| U.S. Virgin Islanders | 0.0 /100 | #293 | Tragic 22.5% |