French American Indian vs Ugandan Female Poverty Among 18-24 Year Olds
COMPARE
French American Indian
Ugandan
Female Poverty Among 18-24 Year Olds
Female Poverty Among 18-24 Year Olds Comparison
French American Indians
Ugandans
22.3%
FEMALE POVERTY AMONG 18-24 YEAR OLDS
0.0/ 100
METRIC RATING
289th/ 347
METRIC RANK
22.1%
FEMALE POVERTY AMONG 18-24 YEAR OLDS
0.0/ 100
METRIC RATING
286th/ 347
METRIC RANK
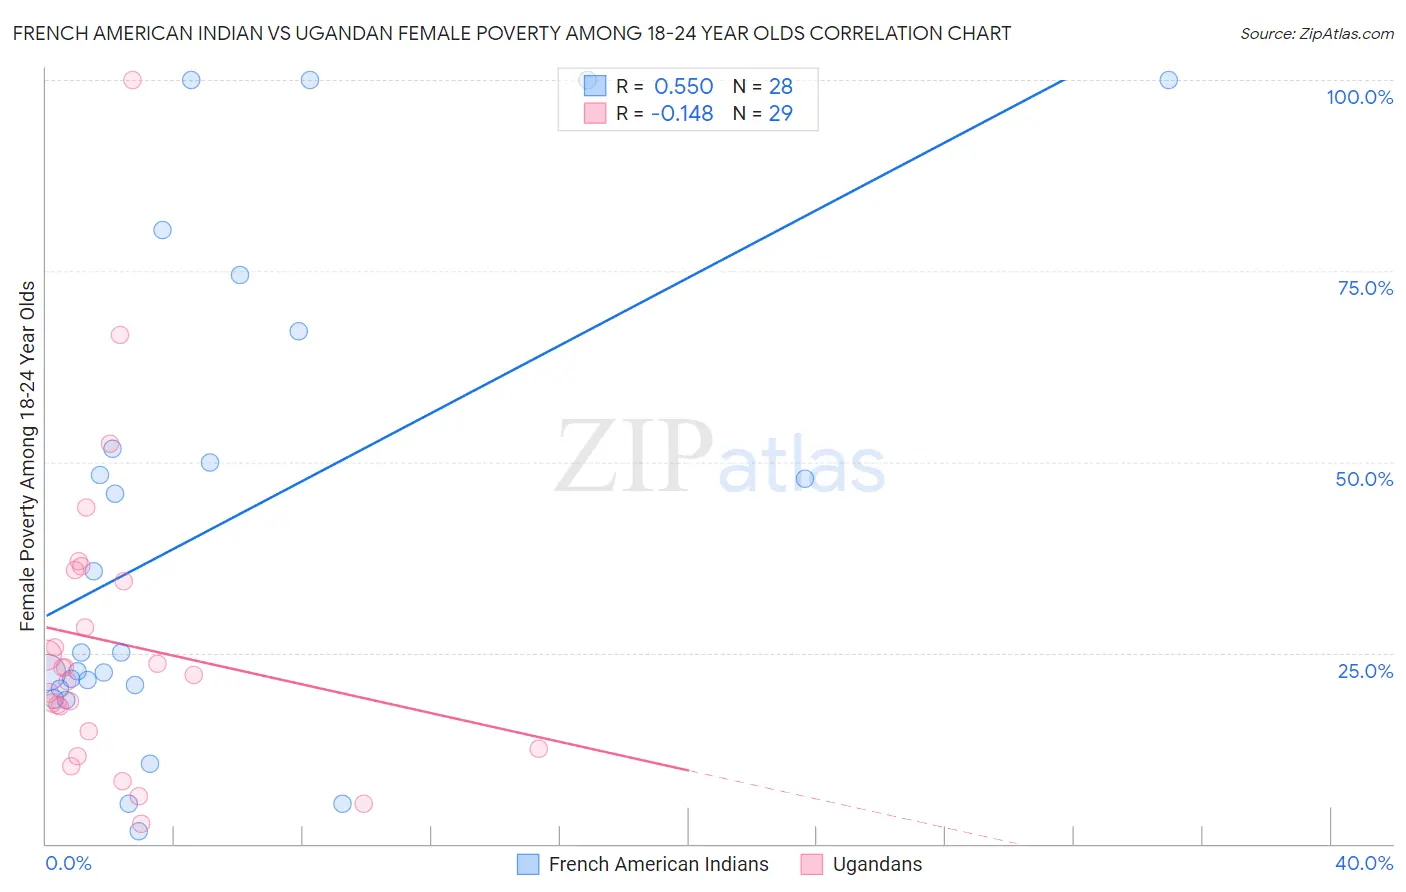
French American Indian vs Ugandan Female Poverty Among 18-24 Year Olds Correlation Chart
The statistical analysis conducted on geographies consisting of 130,637,035 people shows a substantial positive correlation between the proportion of French American Indians and poverty level among females between the ages 18 and 24 in the United States with a correlation coefficient (R) of 0.550 and weighted average of 22.3%. Similarly, the statistical analysis conducted on geographies consisting of 93,585,105 people shows a poor negative correlation between the proportion of Ugandans and poverty level among females between the ages 18 and 24 in the United States with a correlation coefficient (R) of -0.148 and weighted average of 22.1%, a difference of 0.84%.
Female Poverty Among 18-24 Year Olds Correlation Summary
| Measurement | French American Indian | Ugandan |
| Minimum | 1.6% | 2.7% |
| Maximum | 100.0% | 100.0% |
| Range | 98.4% | 97.3% |
| Mean | 41.6% | 26.3% |
| Median | 25.1% | 22.0% |
| Interquartile 25% (IQ1) | 20.6% | 13.6% |
| Interquartile 75% (IQ3) | 59.4% | 35.1% |
| Interquartile Range (IQR) | 38.8% | 21.5% |
| Standard Deviation (Sample) | 31.5% | 20.1% |
| Standard Deviation (Population) | 30.9% | 19.8% |
Demographics Similar to French American Indians and Ugandans by Female Poverty Among 18-24 Year Olds
In terms of female poverty among 18-24 year olds, the demographic groups most similar to French American Indians are Dominican (22.3%, a difference of 0.070%), Immigrants from Senegal (22.4%, a difference of 0.58%), Immigrants from Middle Africa (22.1%, a difference of 0.83%), Bangladeshi (22.5%, a difference of 0.86%), and Alaskan Athabascan (22.5%, a difference of 0.91%). Similarly, the demographic groups most similar to Ugandans are Immigrants from Middle Africa (22.1%, a difference of 0.010%), Ottawa (22.0%, a difference of 0.19%), Tlingit-Haida (22.0%, a difference of 0.31%), Subsaharan African (22.0%, a difference of 0.32%), and Bermudan (21.9%, a difference of 0.62%).
| Demographics | Rating | Rank | Female Poverty Among 18-24 Year Olds |
| Immigrants | Switzerland | 0.1 /100 | #277 | Tragic 21.8% |
| Yaqui | 0.1 /100 | #278 | Tragic 21.9% |
| Spanish Americans | 0.1 /100 | #279 | Tragic 21.9% |
| Immigrants | Dominica | 0.1 /100 | #280 | Tragic 21.9% |
| Immigrants | Dominican Republic | 0.1 /100 | #281 | Tragic 21.9% |
| Bermudans | 0.1 /100 | #282 | Tragic 21.9% |
| Sub-Saharan Africans | 0.0 /100 | #283 | Tragic 22.0% |
| Tlingit-Haida | 0.0 /100 | #284 | Tragic 22.0% |
| Ottawa | 0.0 /100 | #285 | Tragic 22.0% |
| Ugandans | 0.0 /100 | #286 | Tragic 22.1% |
| Immigrants | Middle Africa | 0.0 /100 | #287 | Tragic 22.1% |
| Dominicans | 0.0 /100 | #288 | Tragic 22.3% |
| French American Indians | 0.0 /100 | #289 | Tragic 22.3% |
| Immigrants | Senegal | 0.0 /100 | #290 | Tragic 22.4% |
| Bangladeshis | 0.0 /100 | #291 | Tragic 22.5% |
| Alaskan Athabascans | 0.0 /100 | #292 | Tragic 22.5% |
| U.S. Virgin Islanders | 0.0 /100 | #293 | Tragic 22.5% |
| Indonesians | 0.0 /100 | #294 | Tragic 22.5% |
| Shoshone | 0.0 /100 | #295 | Tragic 22.5% |
| Menominee | 0.0 /100 | #296 | Tragic 22.5% |
| Inupiat | 0.0 /100 | #297 | Tragic 22.6% |