Lithuanian vs Immigrants from Ethiopia Female Poverty Among 18-24 Year Olds
COMPARE
Lithuanian
Immigrants from Ethiopia
Female Poverty Among 18-24 Year Olds
Female Poverty Among 18-24 Year Olds Comparison
Lithuanians
Immigrants from Ethiopia
18.7%
FEMALE POVERTY AMONG 18-24 YEAR OLDS
99.7/ 100
METRIC RATING
73rd/ 347
METRIC RANK
20.2%
FEMALE POVERTY AMONG 18-24 YEAR OLDS
37.3/ 100
METRIC RATING
186th/ 347
METRIC RANK
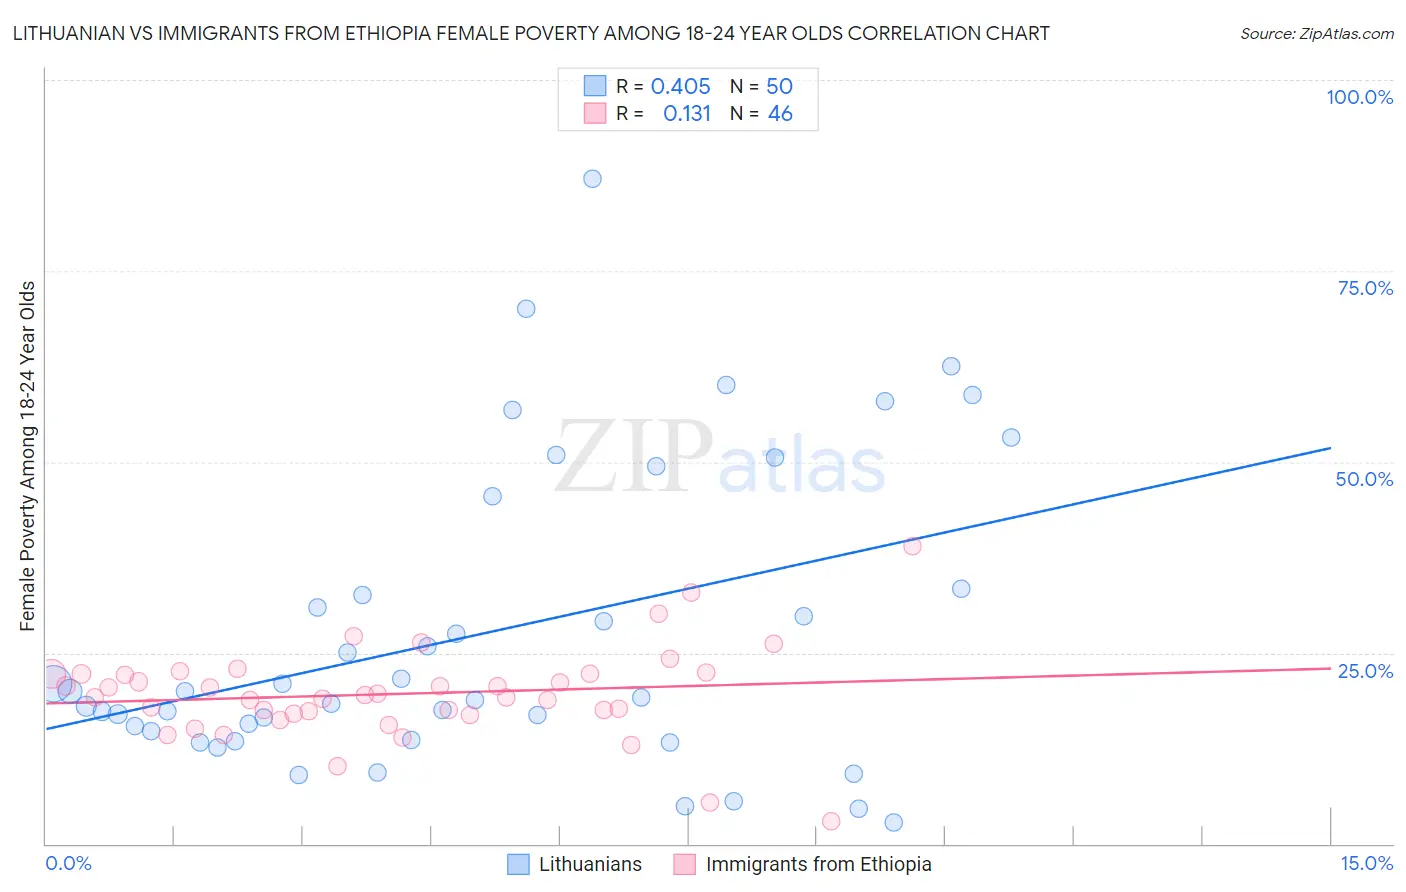
Lithuanian vs Immigrants from Ethiopia Female Poverty Among 18-24 Year Olds Correlation Chart
The statistical analysis conducted on geographies consisting of 405,735,156 people shows a moderate positive correlation between the proportion of Lithuanians and poverty level among females between the ages 18 and 24 in the United States with a correlation coefficient (R) of 0.405 and weighted average of 18.7%. Similarly, the statistical analysis conducted on geographies consisting of 209,579,558 people shows a poor positive correlation between the proportion of Immigrants from Ethiopia and poverty level among females between the ages 18 and 24 in the United States with a correlation coefficient (R) of 0.131 and weighted average of 20.2%, a difference of 8.2%.
Female Poverty Among 18-24 Year Olds Correlation Summary
| Measurement | Lithuanian | Immigrants from Ethiopia |
| Minimum | 2.8% | 3.0% |
| Maximum | 87.0% | 39.0% |
| Range | 84.2% | 36.0% |
| Mean | 27.5% | 19.6% |
| Median | 19.6% | 19.3% |
| Interquartile 25% (IQ1) | 14.8% | 17.1% |
| Interquartile 75% (IQ3) | 33.3% | 22.2% |
| Interquartile Range (IQR) | 18.6% | 5.1% |
| Standard Deviation (Sample) | 19.6% | 6.1% |
| Standard Deviation (Population) | 19.4% | 6.1% |
Similar Demographics by Female Poverty Among 18-24 Year Olds
Demographics Similar to Lithuanians by Female Poverty Among 18-24 Year Olds
In terms of female poverty among 18-24 year olds, the demographic groups most similar to Lithuanians are Armenian (18.7%, a difference of 0.040%), Immigrants from Haiti (18.7%, a difference of 0.060%), Immigrants from Costa Rica (18.7%, a difference of 0.12%), Hawaiian (18.7%, a difference of 0.19%), and Immigrants from Bulgaria (18.6%, a difference of 0.23%).
| Demographics | Rating | Rank | Female Poverty Among 18-24 Year Olds |
| Jordanians | 99.8 /100 | #66 | Exceptional 18.6% |
| Immigrants | Korea | 99.8 /100 | #67 | Exceptional 18.6% |
| Brazilians | 99.8 /100 | #68 | Exceptional 18.6% |
| Immigrants | Bulgaria | 99.7 /100 | #69 | Exceptional 18.6% |
| Immigrants | Costa Rica | 99.7 /100 | #70 | Exceptional 18.7% |
| Immigrants | Haiti | 99.7 /100 | #71 | Exceptional 18.7% |
| Armenians | 99.7 /100 | #72 | Exceptional 18.7% |
| Lithuanians | 99.7 /100 | #73 | Exceptional 18.7% |
| Hawaiians | 99.6 /100 | #74 | Exceptional 18.7% |
| Poles | 99.6 /100 | #75 | Exceptional 18.8% |
| Immigrants | Cambodia | 99.5 /100 | #76 | Exceptional 18.8% |
| Costa Ricans | 99.5 /100 | #77 | Exceptional 18.8% |
| Immigrants | Europe | 99.5 /100 | #78 | Exceptional 18.8% |
| Uruguayans | 99.5 /100 | #79 | Exceptional 18.8% |
| Palestinians | 99.5 /100 | #80 | Exceptional 18.8% |
Demographics Similar to Immigrants from Ethiopia by Female Poverty Among 18-24 Year Olds
In terms of female poverty among 18-24 year olds, the demographic groups most similar to Immigrants from Ethiopia are Immigrants from Mexico (20.2%, a difference of 0.050%), Nepalese (20.2%, a difference of 0.12%), Immigrants from Central America (20.2%, a difference of 0.14%), Scandinavian (20.3%, a difference of 0.14%), and Lebanese (20.2%, a difference of 0.17%).
| Demographics | Rating | Rank | Female Poverty Among 18-24 Year Olds |
| Ethiopians | 43.8 /100 | #179 | Average 20.2% |
| Iraqis | 43.3 /100 | #180 | Average 20.2% |
| Immigrants | China | 43.0 /100 | #181 | Average 20.2% |
| Immigrants | Barbados | 42.8 /100 | #182 | Average 20.2% |
| Lebanese | 40.6 /100 | #183 | Average 20.2% |
| Immigrants | Central America | 39.9 /100 | #184 | Fair 20.2% |
| Nepalese | 39.7 /100 | #185 | Fair 20.2% |
| Immigrants | Ethiopia | 37.3 /100 | #186 | Fair 20.2% |
| Immigrants | Mexico | 36.3 /100 | #187 | Fair 20.2% |
| Scandinavians | 34.6 /100 | #188 | Fair 20.3% |
| Immigrants | Germany | 34.0 /100 | #189 | Fair 20.3% |
| Immigrants | Western Asia | 29.3 /100 | #190 | Fair 20.3% |
| Moroccans | 25.8 /100 | #191 | Fair 20.4% |
| Immigrants | Israel | 24.4 /100 | #192 | Fair 20.4% |
| Nigerians | 23.4 /100 | #193 | Fair 20.4% |