Lithuanian vs Ghanaian Female Poverty Among 18-24 Year Olds
COMPARE
Lithuanian
Ghanaian
Female Poverty Among 18-24 Year Olds
Female Poverty Among 18-24 Year Olds Comparison
Lithuanians
Ghanaians
18.7%
FEMALE POVERTY AMONG 18-24 YEAR OLDS
99.7/ 100
METRIC RATING
73rd/ 347
METRIC RANK
20.8%
FEMALE POVERTY AMONG 18-24 YEAR OLDS
6.5/ 100
METRIC RATING
228th/ 347
METRIC RANK
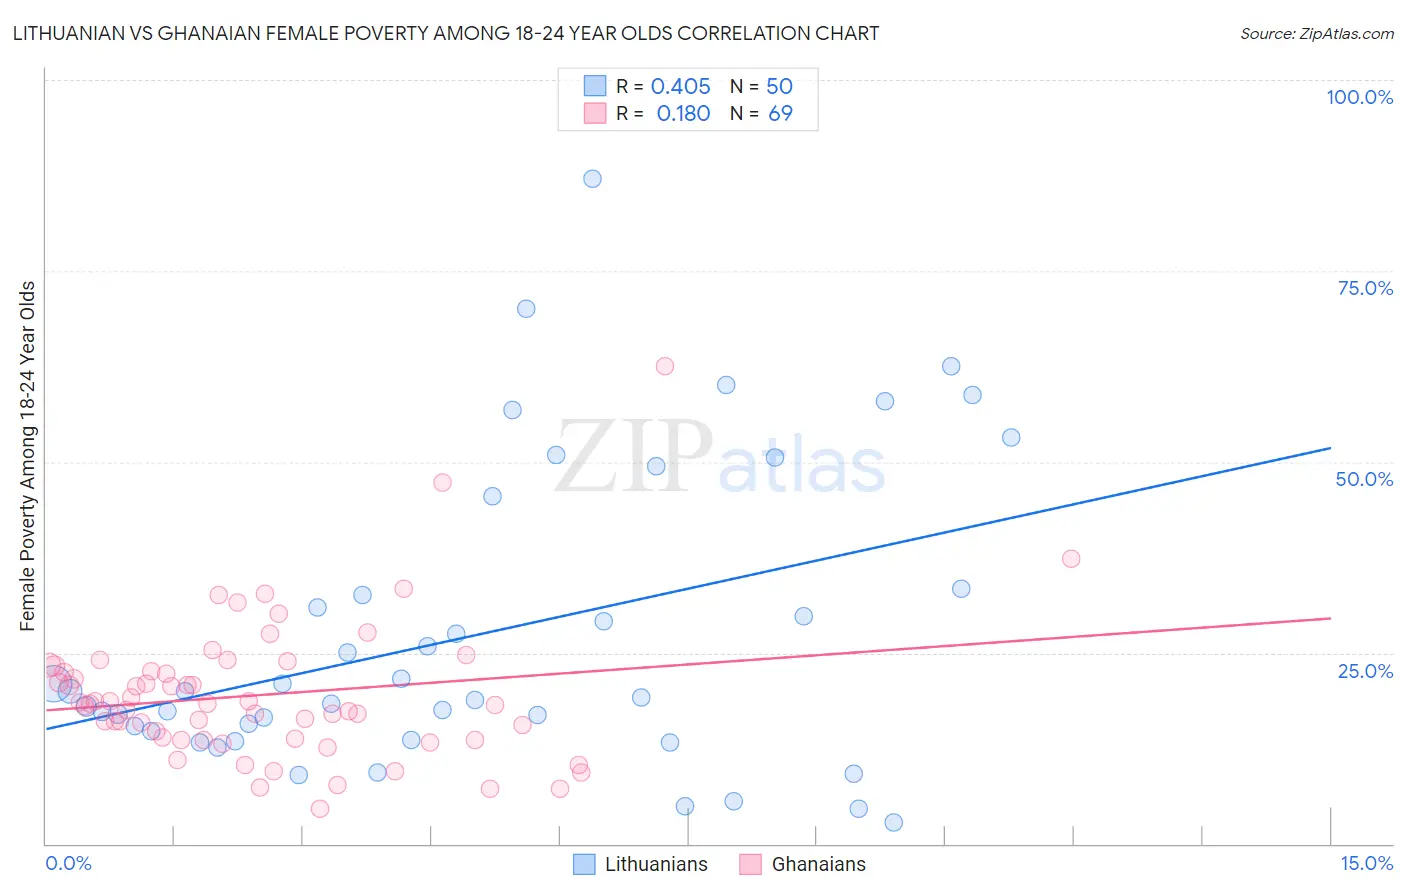
Lithuanian vs Ghanaian Female Poverty Among 18-24 Year Olds Correlation Chart
The statistical analysis conducted on geographies consisting of 405,735,156 people shows a moderate positive correlation between the proportion of Lithuanians and poverty level among females between the ages 18 and 24 in the United States with a correlation coefficient (R) of 0.405 and weighted average of 18.7%. Similarly, the statistical analysis conducted on geographies consisting of 188,784,310 people shows a poor positive correlation between the proportion of Ghanaians and poverty level among females between the ages 18 and 24 in the United States with a correlation coefficient (R) of 0.180 and weighted average of 20.8%, a difference of 11.1%.
Female Poverty Among 18-24 Year Olds Correlation Summary
| Measurement | Lithuanian | Ghanaian |
| Minimum | 2.8% | 4.6% |
| Maximum | 87.0% | 62.5% |
| Range | 84.2% | 57.9% |
| Mean | 27.5% | 19.5% |
| Median | 19.6% | 18.3% |
| Interquartile 25% (IQ1) | 14.8% | 13.6% |
| Interquartile 75% (IQ3) | 33.3% | 22.9% |
| Interquartile Range (IQR) | 18.6% | 9.3% |
| Standard Deviation (Sample) | 19.6% | 9.3% |
| Standard Deviation (Population) | 19.4% | 9.2% |
Similar Demographics by Female Poverty Among 18-24 Year Olds
Demographics Similar to Lithuanians by Female Poverty Among 18-24 Year Olds
In terms of female poverty among 18-24 year olds, the demographic groups most similar to Lithuanians are Armenian (18.7%, a difference of 0.040%), Immigrants from Haiti (18.7%, a difference of 0.060%), Immigrants from Costa Rica (18.7%, a difference of 0.12%), Hawaiian (18.7%, a difference of 0.19%), and Immigrants from Bulgaria (18.6%, a difference of 0.23%).
| Demographics | Rating | Rank | Female Poverty Among 18-24 Year Olds |
| Jordanians | 99.8 /100 | #66 | Exceptional 18.6% |
| Immigrants | Korea | 99.8 /100 | #67 | Exceptional 18.6% |
| Brazilians | 99.8 /100 | #68 | Exceptional 18.6% |
| Immigrants | Bulgaria | 99.7 /100 | #69 | Exceptional 18.6% |
| Immigrants | Costa Rica | 99.7 /100 | #70 | Exceptional 18.7% |
| Immigrants | Haiti | 99.7 /100 | #71 | Exceptional 18.7% |
| Armenians | 99.7 /100 | #72 | Exceptional 18.7% |
| Lithuanians | 99.7 /100 | #73 | Exceptional 18.7% |
| Hawaiians | 99.6 /100 | #74 | Exceptional 18.7% |
| Poles | 99.6 /100 | #75 | Exceptional 18.8% |
| Immigrants | Cambodia | 99.5 /100 | #76 | Exceptional 18.8% |
| Costa Ricans | 99.5 /100 | #77 | Exceptional 18.8% |
| Immigrants | Europe | 99.5 /100 | #78 | Exceptional 18.8% |
| Uruguayans | 99.5 /100 | #79 | Exceptional 18.8% |
| Palestinians | 99.5 /100 | #80 | Exceptional 18.8% |
Demographics Similar to Ghanaians by Female Poverty Among 18-24 Year Olds
In terms of female poverty among 18-24 year olds, the demographic groups most similar to Ghanaians are Immigrants from Sweden (20.7%, a difference of 0.060%), Australian (20.8%, a difference of 0.070%), White/Caucasian (20.8%, a difference of 0.070%), Immigrants from St. Vincent and the Grenadines (20.8%, a difference of 0.090%), and Finnish (20.8%, a difference of 0.10%).
| Demographics | Rating | Rank | Female Poverty Among 18-24 Year Olds |
| Barbadians | 9.0 /100 | #221 | Tragic 20.7% |
| Guatemalans | 8.1 /100 | #222 | Tragic 20.7% |
| French | 7.9 /100 | #223 | Tragic 20.7% |
| Immigrants | Liberia | 7.6 /100 | #224 | Tragic 20.7% |
| Norwegians | 7.3 /100 | #225 | Tragic 20.7% |
| Estonians | 7.2 /100 | #226 | Tragic 20.7% |
| Immigrants | Sweden | 6.8 /100 | #227 | Tragic 20.7% |
| Ghanaians | 6.5 /100 | #228 | Tragic 20.8% |
| Australians | 6.1 /100 | #229 | Tragic 20.8% |
| Whites/Caucasians | 6.1 /100 | #230 | Tragic 20.8% |
| Immigrants | St. Vincent and the Grenadines | 6.0 /100 | #231 | Tragic 20.8% |
| Finns | 6.0 /100 | #232 | Tragic 20.8% |
| Immigrants | Denmark | 5.8 /100 | #233 | Tragic 20.8% |
| Welsh | 5.4 /100 | #234 | Tragic 20.8% |
| Immigrants | Uganda | 5.1 /100 | #235 | Tragic 20.8% |