Lithuanian vs Immigrants from Laos Male Poverty
COMPARE
Lithuanian
Immigrants from Laos
Male Poverty
Male Poverty Comparison
Lithuanians
Immigrants from Laos
9.5%
MALE POVERTY
99.8/ 100
METRIC RATING
18th/ 347
METRIC RANK
12.6%
MALE POVERTY
0.5/ 100
METRIC RATING
235th/ 347
METRIC RANK
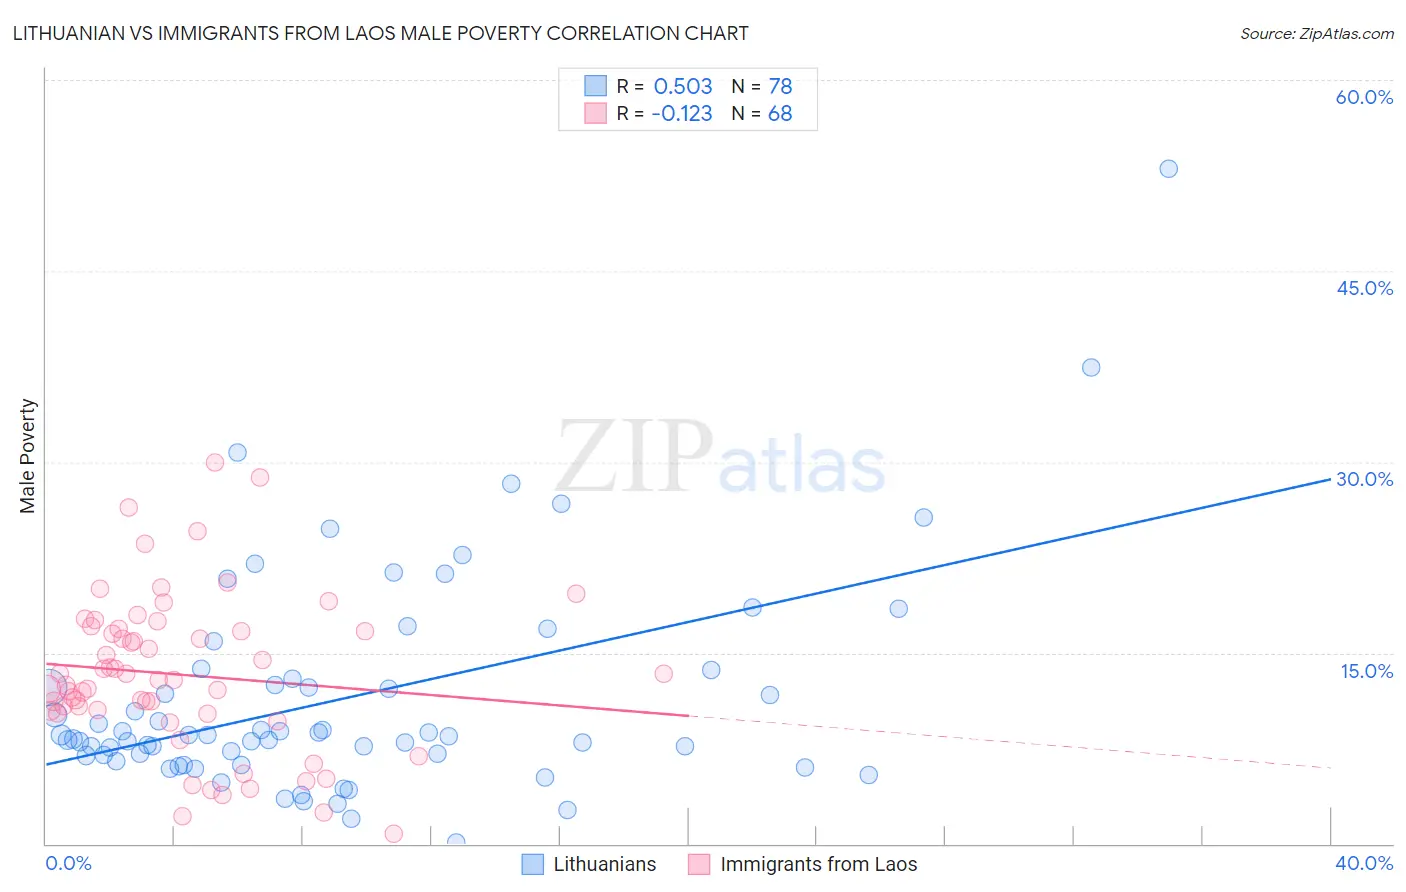
Lithuanian vs Immigrants from Laos Male Poverty Correlation Chart
The statistical analysis conducted on geographies consisting of 421,480,494 people shows a substantial positive correlation between the proportion of Lithuanians and poverty level among males in the United States with a correlation coefficient (R) of 0.503 and weighted average of 9.5%. Similarly, the statistical analysis conducted on geographies consisting of 201,450,990 people shows a poor negative correlation between the proportion of Immigrants from Laos and poverty level among males in the United States with a correlation coefficient (R) of -0.123 and weighted average of 12.6%, a difference of 32.5%.
Male Poverty Correlation Summary
| Measurement | Lithuanian | Immigrants from Laos |
| Minimum | 0.15% | 0.78% |
| Maximum | 53.0% | 29.9% |
| Range | 52.8% | 29.2% |
| Mean | 11.4% | 13.3% |
| Median | 8.5% | 12.9% |
| Interquartile 25% (IQ1) | 6.9% | 10.3% |
| Interquartile 75% (IQ3) | 13.0% | 16.8% |
| Interquartile Range (IQR) | 6.0% | 6.4% |
| Standard Deviation (Sample) | 8.6% | 6.1% |
| Standard Deviation (Population) | 8.6% | 6.1% |
Similar Demographics by Male Poverty
Demographics Similar to Lithuanians by Male Poverty
In terms of male poverty, the demographic groups most similar to Lithuanians are Norwegian (9.5%, a difference of 0.17%), Immigrants from Hong Kong (9.6%, a difference of 0.18%), Latvian (9.6%, a difference of 0.28%), Luxembourger (9.5%, a difference of 0.30%), and Immigrants from Scotland (9.6%, a difference of 0.55%).
| Demographics | Rating | Rank | Male Poverty |
| Bolivians | 99.9 /100 | #11 | Exceptional 9.4% |
| Immigrants | Bolivia | 99.9 /100 | #12 | Exceptional 9.4% |
| Immigrants | Lithuania | 99.9 /100 | #13 | Exceptional 9.4% |
| Immigrants | North Macedonia | 99.8 /100 | #14 | Exceptional 9.4% |
| Bhutanese | 99.8 /100 | #15 | Exceptional 9.5% |
| Luxembourgers | 99.8 /100 | #16 | Exceptional 9.5% |
| Norwegians | 99.8 /100 | #17 | Exceptional 9.5% |
| Lithuanians | 99.8 /100 | #18 | Exceptional 9.5% |
| Immigrants | Hong Kong | 99.7 /100 | #19 | Exceptional 9.6% |
| Latvians | 99.7 /100 | #20 | Exceptional 9.6% |
| Immigrants | Scotland | 99.7 /100 | #21 | Exceptional 9.6% |
| Croatians | 99.7 /100 | #22 | Exceptional 9.6% |
| Italians | 99.7 /100 | #23 | Exceptional 9.6% |
| Swedes | 99.7 /100 | #24 | Exceptional 9.6% |
| Eastern Europeans | 99.6 /100 | #25 | Exceptional 9.6% |
Demographics Similar to Immigrants from Laos by Male Poverty
In terms of male poverty, the demographic groups most similar to Immigrants from Laos are Immigrants from Saudi Arabia (12.7%, a difference of 0.25%), French American Indian (12.7%, a difference of 0.29%), Ecuadorian (12.7%, a difference of 0.32%), Ghanaian (12.7%, a difference of 0.33%), and Immigrants from Armenia (12.6%, a difference of 0.36%).
| Demographics | Rating | Rank | Male Poverty |
| Alsatians | 1.3 /100 | #228 | Tragic 12.4% |
| Cubans | 1.3 /100 | #229 | Tragic 12.4% |
| Marshallese | 0.8 /100 | #230 | Tragic 12.5% |
| Salvadorans | 0.6 /100 | #231 | Tragic 12.6% |
| Nicaraguans | 0.6 /100 | #232 | Tragic 12.6% |
| Fijians | 0.6 /100 | #233 | Tragic 12.6% |
| Immigrants | Armenia | 0.6 /100 | #234 | Tragic 12.6% |
| Immigrants | Laos | 0.5 /100 | #235 | Tragic 12.6% |
| Immigrants | Saudi Arabia | 0.4 /100 | #236 | Tragic 12.7% |
| French American Indians | 0.4 /100 | #237 | Tragic 12.7% |
| Ecuadorians | 0.4 /100 | #238 | Tragic 12.7% |
| Ghanaians | 0.4 /100 | #239 | Tragic 12.7% |
| Immigrants | Middle Africa | 0.4 /100 | #240 | Tragic 12.7% |
| Sudanese | 0.3 /100 | #241 | Tragic 12.8% |
| Nepalese | 0.3 /100 | #242 | Tragic 12.8% |