Lithuanian vs Immigrants from Laos Professional Degree
COMPARE
Lithuanian
Immigrants from Laos
Professional Degree
Professional Degree Comparison
Lithuanians
Immigrants from Laos
5.4%
PROFESSIONAL DEGREE
99.8/ 100
METRIC RATING
72nd/ 347
METRIC RANK
3.2%
PROFESSIONAL DEGREE
0.1/ 100
METRIC RATING
315th/ 347
METRIC RANK
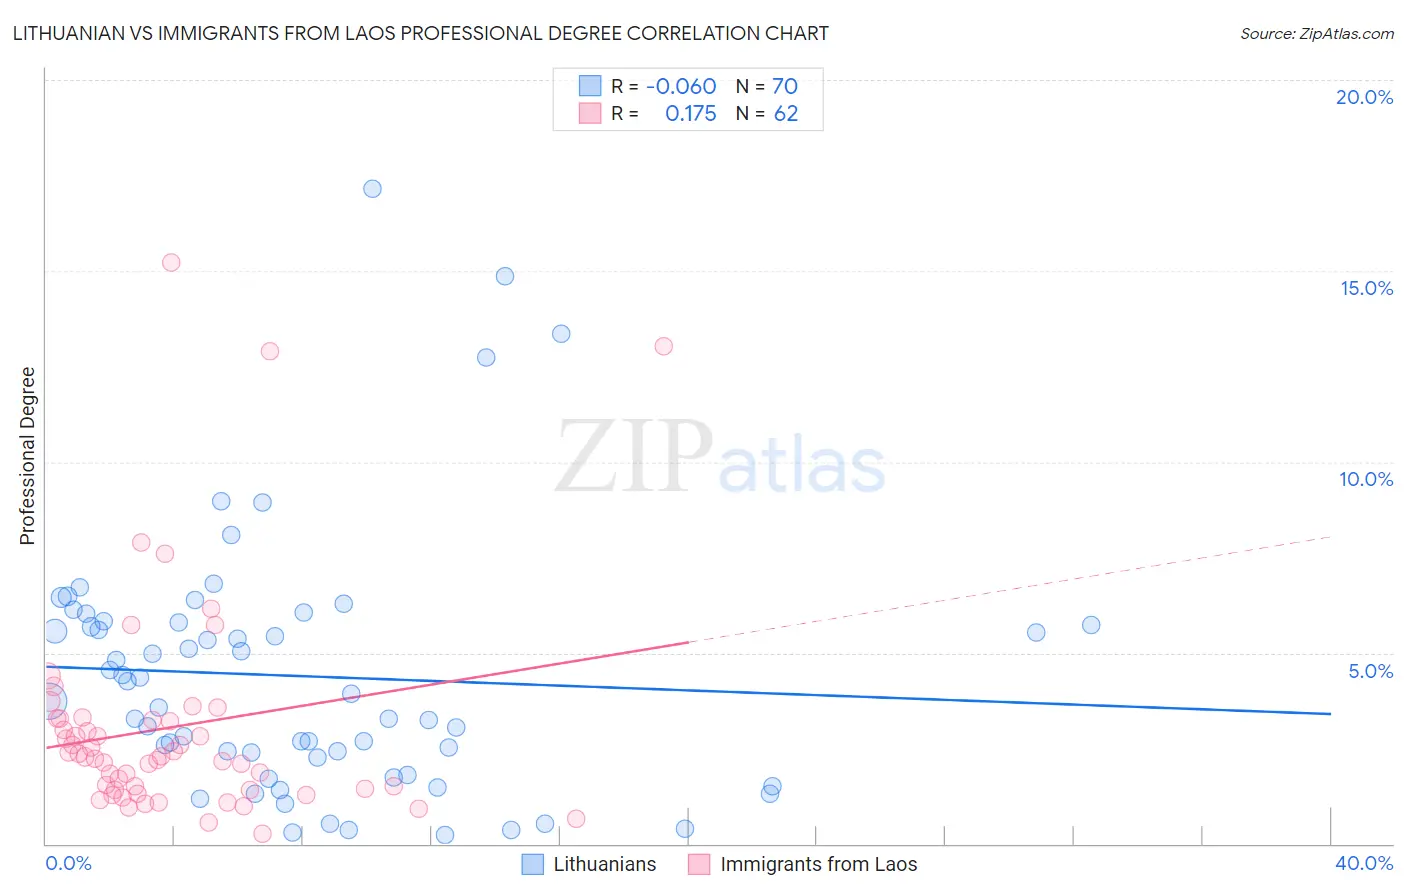
Lithuanian vs Immigrants from Laos Professional Degree Correlation Chart
The statistical analysis conducted on geographies consisting of 420,702,228 people shows a slight negative correlation between the proportion of Lithuanians and percentage of population with at least professional degree education in the United States with a correlation coefficient (R) of -0.060 and weighted average of 5.4%. Similarly, the statistical analysis conducted on geographies consisting of 201,278,168 people shows a poor positive correlation between the proportion of Immigrants from Laos and percentage of population with at least professional degree education in the United States with a correlation coefficient (R) of 0.175 and weighted average of 3.2%, a difference of 65.9%.
Professional Degree Correlation Summary
| Measurement | Lithuanian | Immigrants from Laos |
| Minimum | 0.24% | 0.26% |
| Maximum | 17.2% | 15.2% |
| Range | 16.9% | 15.0% |
| Mean | 4.4% | 3.1% |
| Median | 3.8% | 2.3% |
| Interquartile 25% (IQ1) | 2.3% | 1.4% |
| Interquartile 75% (IQ3) | 5.8% | 3.3% |
| Interquartile Range (IQR) | 3.5% | 1.9% |
| Standard Deviation (Sample) | 3.4% | 2.9% |
| Standard Deviation (Population) | 3.3% | 2.9% |
Similar Demographics by Professional Degree
Demographics Similar to Lithuanians by Professional Degree
In terms of professional degree, the demographic groups most similar to Lithuanians are Immigrants from Romania (5.4%, a difference of 0.10%), Ethiopian (5.4%, a difference of 0.47%), Immigrants from Western Asia (5.4%, a difference of 0.48%), Immigrants from Indonesia (5.3%, a difference of 0.61%), and Immigrants from Canada (5.3%, a difference of 0.69%).
| Demographics | Rating | Rank | Professional Degree |
| Immigrants | Bolivia | 99.9 /100 | #65 | Exceptional 5.5% |
| Immigrants | Kazakhstan | 99.9 /100 | #66 | Exceptional 5.5% |
| Immigrants | Bulgaria | 99.9 /100 | #67 | Exceptional 5.5% |
| Immigrants | Lebanon | 99.9 /100 | #68 | Exceptional 5.5% |
| Immigrants | Hungary | 99.9 /100 | #69 | Exceptional 5.5% |
| Bhutanese | 99.8 /100 | #70 | Exceptional 5.4% |
| Immigrants | Western Asia | 99.8 /100 | #71 | Exceptional 5.4% |
| Lithuanians | 99.8 /100 | #72 | Exceptional 5.4% |
| Immigrants | Romania | 99.8 /100 | #73 | Exceptional 5.4% |
| Ethiopians | 99.7 /100 | #74 | Exceptional 5.4% |
| Immigrants | Indonesia | 99.7 /100 | #75 | Exceptional 5.3% |
| Immigrants | Canada | 99.7 /100 | #76 | Exceptional 5.3% |
| Immigrants | Ethiopia | 99.7 /100 | #77 | Exceptional 5.3% |
| Armenians | 99.7 /100 | #78 | Exceptional 5.3% |
| Immigrants | North America | 99.7 /100 | #79 | Exceptional 5.3% |
Demographics Similar to Immigrants from Laos by Professional Degree
In terms of professional degree, the demographic groups most similar to Immigrants from Laos are Puerto Rican (3.2%, a difference of 0.010%), Nepalese (3.2%, a difference of 0.22%), Immigrants from Micronesia (3.2%, a difference of 0.25%), Choctaw (3.2%, a difference of 0.50%), and Mexican American Indian (3.3%, a difference of 0.68%).
| Demographics | Rating | Rank | Professional Degree |
| Shoshone | 0.1 /100 | #308 | Tragic 3.3% |
| Pima | 0.1 /100 | #309 | Tragic 3.3% |
| Immigrants | Latin America | 0.1 /100 | #310 | Tragic 3.3% |
| Cherokee | 0.1 /100 | #311 | Tragic 3.3% |
| Sioux | 0.1 /100 | #312 | Tragic 3.3% |
| Yuman | 0.1 /100 | #313 | Tragic 3.3% |
| Mexican American Indians | 0.1 /100 | #314 | Tragic 3.3% |
| Immigrants | Laos | 0.1 /100 | #315 | Tragic 3.2% |
| Puerto Ricans | 0.1 /100 | #316 | Tragic 3.2% |
| Nepalese | 0.1 /100 | #317 | Tragic 3.2% |
| Immigrants | Micronesia | 0.1 /100 | #318 | Tragic 3.2% |
| Choctaw | 0.1 /100 | #319 | Tragic 3.2% |
| Seminole | 0.1 /100 | #320 | Tragic 3.2% |
| Tsimshian | 0.0 /100 | #321 | Tragic 3.2% |
| Hispanics or Latinos | 0.0 /100 | #322 | Tragic 3.2% |