Polish vs Immigrants from Laos Male Poverty
COMPARE
Polish
Immigrants from Laos
Male Poverty
Male Poverty Comparison
Poles
Immigrants from Laos
9.7%
MALE POVERTY
99.5/ 100
METRIC RATING
30th/ 347
METRIC RANK
12.6%
MALE POVERTY
0.5/ 100
METRIC RATING
235th/ 347
METRIC RANK
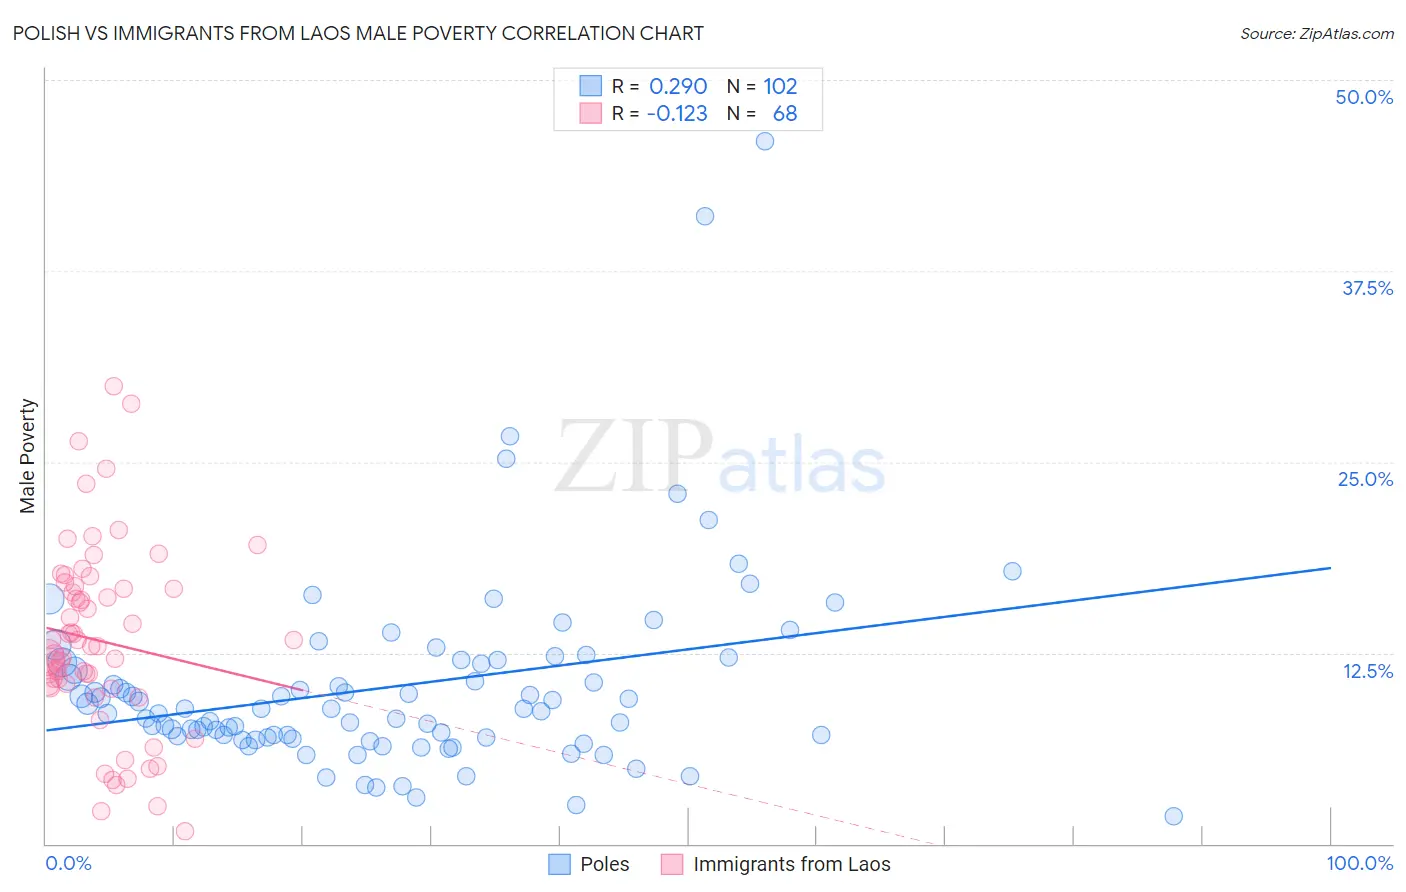
Polish vs Immigrants from Laos Male Poverty Correlation Chart
The statistical analysis conducted on geographies consisting of 558,970,133 people shows a weak positive correlation between the proportion of Poles and poverty level among males in the United States with a correlation coefficient (R) of 0.290 and weighted average of 9.7%. Similarly, the statistical analysis conducted on geographies consisting of 201,450,990 people shows a poor negative correlation between the proportion of Immigrants from Laos and poverty level among males in the United States with a correlation coefficient (R) of -0.123 and weighted average of 12.6%, a difference of 30.1%.
Male Poverty Correlation Summary
| Measurement | Polish | Immigrants from Laos |
| Minimum | 1.8% | 0.78% |
| Maximum | 46.0% | 29.9% |
| Range | 44.2% | 29.2% |
| Mean | 10.3% | 13.3% |
| Median | 8.8% | 12.9% |
| Interquartile 25% (IQ1) | 7.0% | 10.3% |
| Interquartile 75% (IQ3) | 11.9% | 16.8% |
| Interquartile Range (IQR) | 4.9% | 6.4% |
| Standard Deviation (Sample) | 6.5% | 6.1% |
| Standard Deviation (Population) | 6.5% | 6.1% |
Similar Demographics by Male Poverty
Demographics Similar to Poles by Male Poverty
In terms of male poverty, the demographic groups most similar to Poles are Tongan (9.7%, a difference of 0.020%), Greek (9.7%, a difference of 0.080%), Immigrants from Korea (9.7%, a difference of 0.12%), Danish (9.7%, a difference of 0.20%), and Macedonian (9.7%, a difference of 0.23%).
| Demographics | Rating | Rank | Male Poverty |
| Italians | 99.7 /100 | #23 | Exceptional 9.6% |
| Swedes | 99.7 /100 | #24 | Exceptional 9.6% |
| Eastern Europeans | 99.6 /100 | #25 | Exceptional 9.6% |
| Burmese | 99.6 /100 | #26 | Exceptional 9.7% |
| Danes | 99.6 /100 | #27 | Exceptional 9.7% |
| Immigrants | Korea | 99.6 /100 | #28 | Exceptional 9.7% |
| Greeks | 99.6 /100 | #29 | Exceptional 9.7% |
| Poles | 99.5 /100 | #30 | Exceptional 9.7% |
| Tongans | 99.5 /100 | #31 | Exceptional 9.7% |
| Macedonians | 99.5 /100 | #32 | Exceptional 9.7% |
| Immigrants | Northern Europe | 99.5 /100 | #33 | Exceptional 9.7% |
| Immigrants | Poland | 99.5 /100 | #34 | Exceptional 9.8% |
| Iranians | 99.4 /100 | #35 | Exceptional 9.8% |
| Czechs | 99.4 /100 | #36 | Exceptional 9.8% |
| Immigrants | Greece | 99.3 /100 | #37 | Exceptional 9.8% |
Demographics Similar to Immigrants from Laos by Male Poverty
In terms of male poverty, the demographic groups most similar to Immigrants from Laos are Immigrants from Saudi Arabia (12.7%, a difference of 0.25%), French American Indian (12.7%, a difference of 0.29%), Ecuadorian (12.7%, a difference of 0.32%), Ghanaian (12.7%, a difference of 0.33%), and Immigrants from Armenia (12.6%, a difference of 0.36%).
| Demographics | Rating | Rank | Male Poverty |
| Alsatians | 1.3 /100 | #228 | Tragic 12.4% |
| Cubans | 1.3 /100 | #229 | Tragic 12.4% |
| Marshallese | 0.8 /100 | #230 | Tragic 12.5% |
| Salvadorans | 0.6 /100 | #231 | Tragic 12.6% |
| Nicaraguans | 0.6 /100 | #232 | Tragic 12.6% |
| Fijians | 0.6 /100 | #233 | Tragic 12.6% |
| Immigrants | Armenia | 0.6 /100 | #234 | Tragic 12.6% |
| Immigrants | Laos | 0.5 /100 | #235 | Tragic 12.6% |
| Immigrants | Saudi Arabia | 0.4 /100 | #236 | Tragic 12.7% |
| French American Indians | 0.4 /100 | #237 | Tragic 12.7% |
| Ecuadorians | 0.4 /100 | #238 | Tragic 12.7% |
| Ghanaians | 0.4 /100 | #239 | Tragic 12.7% |
| Immigrants | Middle Africa | 0.4 /100 | #240 | Tragic 12.7% |
| Sudanese | 0.3 /100 | #241 | Tragic 12.8% |
| Nepalese | 0.3 /100 | #242 | Tragic 12.8% |