Lithuanian vs Immigrants from China Male Poverty
COMPARE
Lithuanian
Immigrants from China
Male Poverty
Male Poverty Comparison
Lithuanians
Immigrants from China
9.5%
MALE POVERTY
99.8/ 100
METRIC RATING
18th/ 347
METRIC RANK
10.7%
MALE POVERTY
87.1/ 100
METRIC RATING
120th/ 347
METRIC RANK
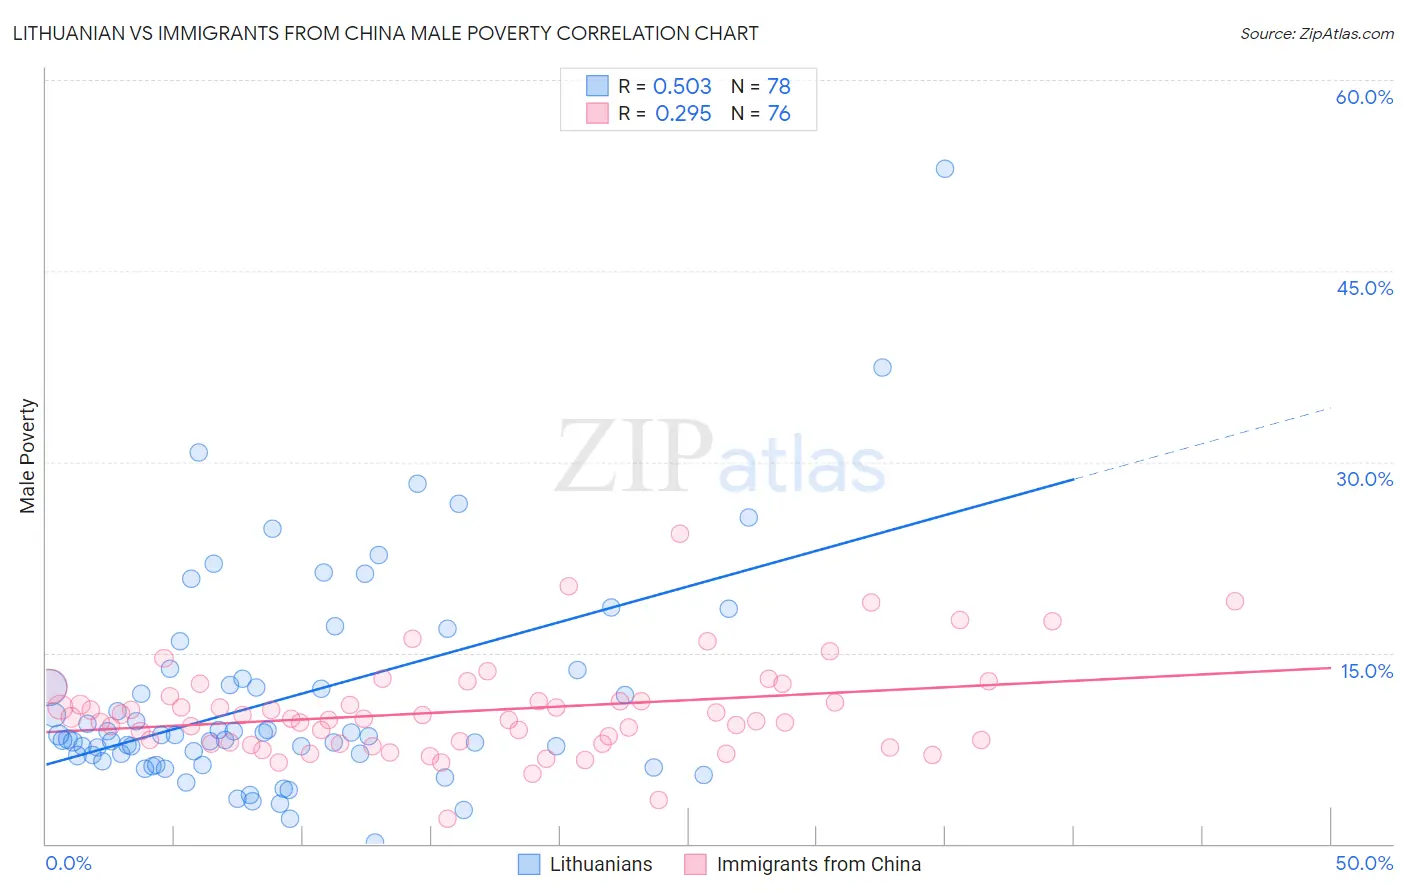
Lithuanian vs Immigrants from China Male Poverty Correlation Chart
The statistical analysis conducted on geographies consisting of 421,480,494 people shows a substantial positive correlation between the proportion of Lithuanians and poverty level among males in the United States with a correlation coefficient (R) of 0.503 and weighted average of 9.5%. Similarly, the statistical analysis conducted on geographies consisting of 456,181,421 people shows a weak positive correlation between the proportion of Immigrants from China and poverty level among males in the United States with a correlation coefficient (R) of 0.295 and weighted average of 10.7%, a difference of 11.7%.
Male Poverty Correlation Summary
| Measurement | Lithuanian | Immigrants from China |
| Minimum | 0.15% | 1.9% |
| Maximum | 53.0% | 24.3% |
| Range | 52.8% | 22.4% |
| Mean | 11.4% | 10.4% |
| Median | 8.5% | 9.8% |
| Interquartile 25% (IQ1) | 6.9% | 7.9% |
| Interquartile 75% (IQ3) | 13.0% | 11.4% |
| Interquartile Range (IQR) | 6.0% | 3.4% |
| Standard Deviation (Sample) | 8.6% | 3.7% |
| Standard Deviation (Population) | 8.6% | 3.7% |
Similar Demographics by Male Poverty
Demographics Similar to Lithuanians by Male Poverty
In terms of male poverty, the demographic groups most similar to Lithuanians are Norwegian (9.5%, a difference of 0.17%), Immigrants from Hong Kong (9.6%, a difference of 0.18%), Latvian (9.6%, a difference of 0.28%), Luxembourger (9.5%, a difference of 0.30%), and Immigrants from Scotland (9.6%, a difference of 0.55%).
| Demographics | Rating | Rank | Male Poverty |
| Bolivians | 99.9 /100 | #11 | Exceptional 9.4% |
| Immigrants | Bolivia | 99.9 /100 | #12 | Exceptional 9.4% |
| Immigrants | Lithuania | 99.9 /100 | #13 | Exceptional 9.4% |
| Immigrants | North Macedonia | 99.8 /100 | #14 | Exceptional 9.4% |
| Bhutanese | 99.8 /100 | #15 | Exceptional 9.5% |
| Luxembourgers | 99.8 /100 | #16 | Exceptional 9.5% |
| Norwegians | 99.8 /100 | #17 | Exceptional 9.5% |
| Lithuanians | 99.8 /100 | #18 | Exceptional 9.5% |
| Immigrants | Hong Kong | 99.7 /100 | #19 | Exceptional 9.6% |
| Latvians | 99.7 /100 | #20 | Exceptional 9.6% |
| Immigrants | Scotland | 99.7 /100 | #21 | Exceptional 9.6% |
| Croatians | 99.7 /100 | #22 | Exceptional 9.6% |
| Italians | 99.7 /100 | #23 | Exceptional 9.6% |
| Swedes | 99.7 /100 | #24 | Exceptional 9.6% |
| Eastern Europeans | 99.6 /100 | #25 | Exceptional 9.6% |
Demographics Similar to Immigrants from China by Male Poverty
In terms of male poverty, the demographic groups most similar to Immigrants from China are Peruvian (10.7%, a difference of 0.010%), Native Hawaiian (10.7%, a difference of 0.030%), South African (10.7%, a difference of 0.070%), Immigrants from Hungary (10.7%, a difference of 0.10%), and French (10.7%, a difference of 0.10%).
| Demographics | Rating | Rank | Male Poverty |
| Palestinians | 89.1 /100 | #113 | Excellent 10.6% |
| Immigrants | Brazil | 89.0 /100 | #114 | Excellent 10.6% |
| Immigrants | Russia | 88.6 /100 | #115 | Excellent 10.6% |
| Sri Lankans | 88.1 /100 | #116 | Excellent 10.6% |
| Immigrants | South Eastern Asia | 88.1 /100 | #117 | Excellent 10.6% |
| Okinawans | 87.6 /100 | #118 | Excellent 10.7% |
| Immigrants | Hungary | 87.6 /100 | #119 | Excellent 10.7% |
| Immigrants | China | 87.1 /100 | #120 | Excellent 10.7% |
| Peruvians | 87.1 /100 | #121 | Excellent 10.7% |
| Native Hawaiians | 87.0 /100 | #122 | Excellent 10.7% |
| South Africans | 86.8 /100 | #123 | Excellent 10.7% |
| French | 86.7 /100 | #124 | Excellent 10.7% |
| Immigrants | Norway | 86.0 /100 | #125 | Excellent 10.7% |
| Immigrants | Ukraine | 84.3 /100 | #126 | Excellent 10.7% |
| Puget Sound Salish | 84.3 /100 | #127 | Excellent 10.7% |