Lithuanian vs Immigrants from Ethiopia Receiving Food Stamps
COMPARE
Lithuanian
Immigrants from Ethiopia
Receiving Food Stamps
Receiving Food Stamps Comparison
Lithuanians
Immigrants from Ethiopia
9.7%
RECEIVING FOOD STAMPS
99.4/ 100
METRIC RATING
50th/ 347
METRIC RANK
10.7%
RECEIVING FOOD STAMPS
92.6/ 100
METRIC RATING
127th/ 347
METRIC RANK
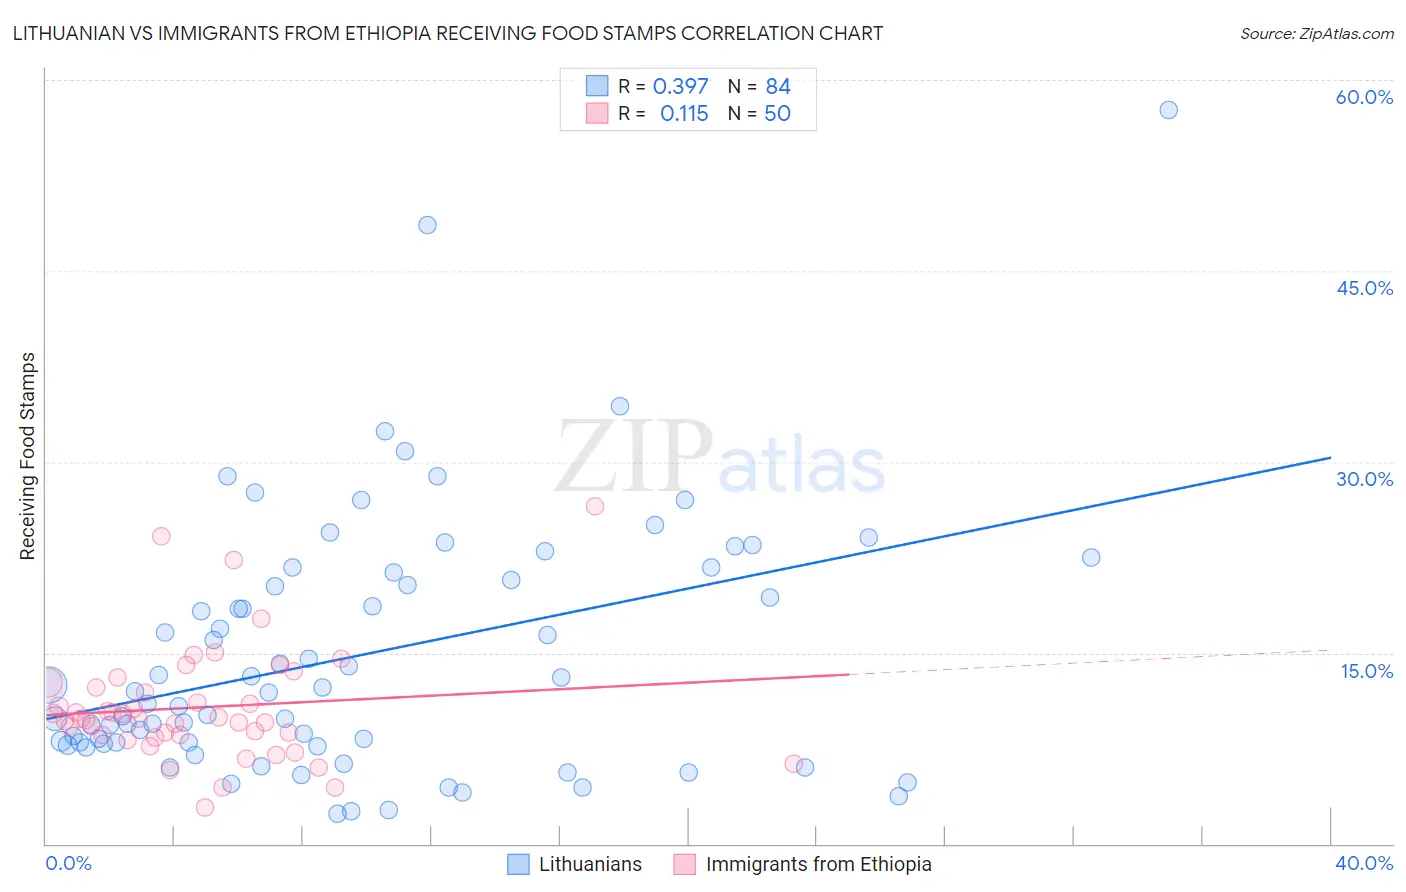
Lithuanian vs Immigrants from Ethiopia Receiving Food Stamps Correlation Chart
The statistical analysis conducted on geographies consisting of 420,339,892 people shows a mild positive correlation between the proportion of Lithuanians and percentage of population receiving government assistance and/or food stamps in the United States with a correlation coefficient (R) of 0.397 and weighted average of 9.7%. Similarly, the statistical analysis conducted on geographies consisting of 211,250,124 people shows a poor positive correlation between the proportion of Immigrants from Ethiopia and percentage of population receiving government assistance and/or food stamps in the United States with a correlation coefficient (R) of 0.115 and weighted average of 10.7%, a difference of 10.7%.
Receiving Food Stamps Correlation Summary
| Measurement | Lithuanian | Immigrants from Ethiopia |
| Minimum | 2.4% | 2.8% |
| Maximum | 57.6% | 26.5% |
| Range | 55.2% | 23.7% |
| Mean | 14.8% | 10.7% |
| Median | 11.9% | 9.8% |
| Interquartile 25% (IQ1) | 7.9% | 8.5% |
| Interquartile 75% (IQ3) | 21.0% | 12.3% |
| Interquartile Range (IQR) | 13.1% | 3.8% |
| Standard Deviation (Sample) | 10.0% | 4.5% |
| Standard Deviation (Population) | 10.0% | 4.5% |
Similar Demographics by Receiving Food Stamps
Demographics Similar to Lithuanians by Receiving Food Stamps
In terms of receiving food stamps, the demographic groups most similar to Lithuanians are Asian (9.7%, a difference of 0.18%), Immigrants from South Africa (9.7%, a difference of 0.19%), Tongan (9.7%, a difference of 0.21%), Immigrants from Czechoslovakia (9.6%, a difference of 0.25%), and Russian (9.6%, a difference of 0.27%).
| Demographics | Rating | Rank | Receiving Food Stamps |
| Croatians | 99.5 /100 | #43 | Exceptional 9.6% |
| Immigrants | Denmark | 99.4 /100 | #44 | Exceptional 9.6% |
| Immigrants | Belgium | 99.4 /100 | #45 | Exceptional 9.6% |
| Australians | 99.4 /100 | #46 | Exceptional 9.6% |
| Indians (Asian) | 99.4 /100 | #47 | Exceptional 9.6% |
| Russians | 99.4 /100 | #48 | Exceptional 9.6% |
| Immigrants | Czechoslovakia | 99.4 /100 | #49 | Exceptional 9.6% |
| Lithuanians | 99.4 /100 | #50 | Exceptional 9.7% |
| Asians | 99.3 /100 | #51 | Exceptional 9.7% |
| Immigrants | South Africa | 99.3 /100 | #52 | Exceptional 9.7% |
| Tongans | 99.3 /100 | #53 | Exceptional 9.7% |
| Swiss | 99.3 /100 | #54 | Exceptional 9.7% |
| Immigrants | Switzerland | 99.3 /100 | #55 | Exceptional 9.7% |
| Immigrants | Canada | 99.3 /100 | #56 | Exceptional 9.7% |
| Greeks | 99.3 /100 | #57 | Exceptional 9.7% |
Demographics Similar to Immigrants from Ethiopia by Receiving Food Stamps
In terms of receiving food stamps, the demographic groups most similar to Immigrants from Ethiopia are Immigrants from Jordan (10.7%, a difference of 0.010%), Yugoslavian (10.7%, a difference of 0.010%), Afghan (10.7%, a difference of 0.020%), Israeli (10.7%, a difference of 0.11%), and French (10.7%, a difference of 0.11%).
| Demographics | Rating | Rank | Receiving Food Stamps |
| Ethiopians | 93.9 /100 | #120 | Exceptional 10.6% |
| Slavs | 93.8 /100 | #121 | Exceptional 10.6% |
| Sri Lankans | 93.7 /100 | #122 | Exceptional 10.6% |
| Immigrants | Philippines | 93.3 /100 | #123 | Exceptional 10.7% |
| Paraguayans | 93.0 /100 | #124 | Exceptional 10.7% |
| Ukrainians | 92.8 /100 | #125 | Exceptional 10.7% |
| Afghans | 92.6 /100 | #126 | Exceptional 10.7% |
| Immigrants | Ethiopia | 92.6 /100 | #127 | Exceptional 10.7% |
| Immigrants | Jordan | 92.5 /100 | #128 | Exceptional 10.7% |
| Yugoslavians | 92.5 /100 | #129 | Exceptional 10.7% |
| Israelis | 92.4 /100 | #130 | Exceptional 10.7% |
| French | 92.3 /100 | #131 | Exceptional 10.7% |
| Immigrants | Germany | 92.0 /100 | #132 | Exceptional 10.7% |
| Immigrants | Russia | 90.9 /100 | #133 | Exceptional 10.8% |
| Immigrants | Brazil | 90.3 /100 | #134 | Exceptional 10.8% |