Polish vs Immigrants from China Male Poverty
COMPARE
Polish
Immigrants from China
Male Poverty
Male Poverty Comparison
Poles
Immigrants from China
9.7%
MALE POVERTY
99.5/ 100
METRIC RATING
30th/ 347
METRIC RANK
10.7%
MALE POVERTY
87.1/ 100
METRIC RATING
120th/ 347
METRIC RANK
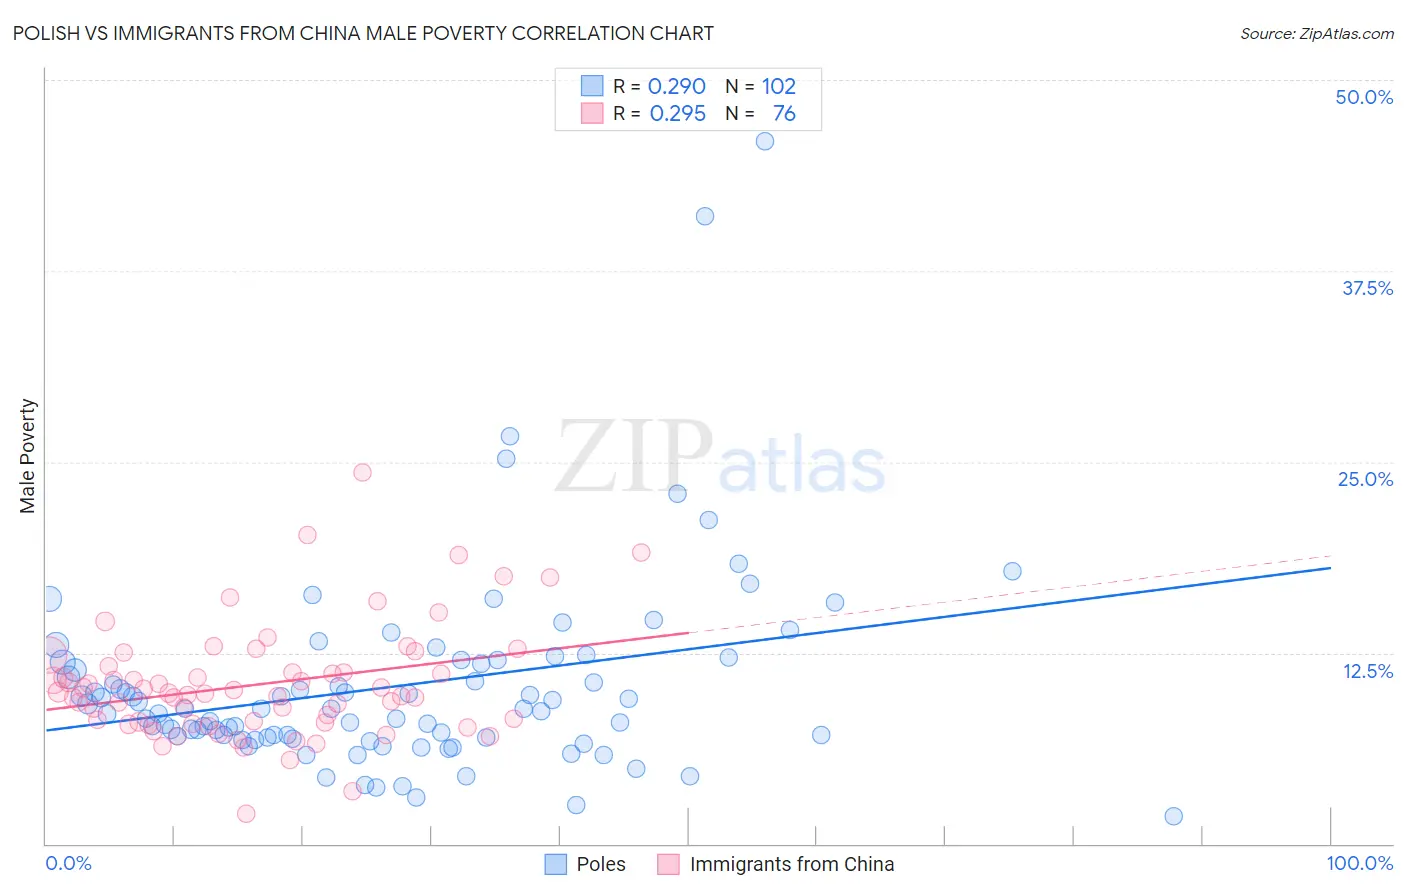
Polish vs Immigrants from China Male Poverty Correlation Chart
The statistical analysis conducted on geographies consisting of 558,970,133 people shows a weak positive correlation between the proportion of Poles and poverty level among males in the United States with a correlation coefficient (R) of 0.290 and weighted average of 9.7%. Similarly, the statistical analysis conducted on geographies consisting of 456,181,421 people shows a weak positive correlation between the proportion of Immigrants from China and poverty level among males in the United States with a correlation coefficient (R) of 0.295 and weighted average of 10.7%, a difference of 9.8%.
Male Poverty Correlation Summary
| Measurement | Polish | Immigrants from China |
| Minimum | 1.8% | 1.9% |
| Maximum | 46.0% | 24.3% |
| Range | 44.2% | 22.4% |
| Mean | 10.3% | 10.4% |
| Median | 8.8% | 9.8% |
| Interquartile 25% (IQ1) | 7.0% | 7.9% |
| Interquartile 75% (IQ3) | 11.9% | 11.4% |
| Interquartile Range (IQR) | 4.9% | 3.4% |
| Standard Deviation (Sample) | 6.5% | 3.7% |
| Standard Deviation (Population) | 6.5% | 3.7% |
Similar Demographics by Male Poverty
Demographics Similar to Poles by Male Poverty
In terms of male poverty, the demographic groups most similar to Poles are Tongan (9.7%, a difference of 0.020%), Greek (9.7%, a difference of 0.080%), Immigrants from Korea (9.7%, a difference of 0.12%), Danish (9.7%, a difference of 0.20%), and Macedonian (9.7%, a difference of 0.23%).
| Demographics | Rating | Rank | Male Poverty |
| Italians | 99.7 /100 | #23 | Exceptional 9.6% |
| Swedes | 99.7 /100 | #24 | Exceptional 9.6% |
| Eastern Europeans | 99.6 /100 | #25 | Exceptional 9.6% |
| Burmese | 99.6 /100 | #26 | Exceptional 9.7% |
| Danes | 99.6 /100 | #27 | Exceptional 9.7% |
| Immigrants | Korea | 99.6 /100 | #28 | Exceptional 9.7% |
| Greeks | 99.6 /100 | #29 | Exceptional 9.7% |
| Poles | 99.5 /100 | #30 | Exceptional 9.7% |
| Tongans | 99.5 /100 | #31 | Exceptional 9.7% |
| Macedonians | 99.5 /100 | #32 | Exceptional 9.7% |
| Immigrants | Northern Europe | 99.5 /100 | #33 | Exceptional 9.7% |
| Immigrants | Poland | 99.5 /100 | #34 | Exceptional 9.8% |
| Iranians | 99.4 /100 | #35 | Exceptional 9.8% |
| Czechs | 99.4 /100 | #36 | Exceptional 9.8% |
| Immigrants | Greece | 99.3 /100 | #37 | Exceptional 9.8% |
Demographics Similar to Immigrants from China by Male Poverty
In terms of male poverty, the demographic groups most similar to Immigrants from China are Peruvian (10.7%, a difference of 0.010%), Native Hawaiian (10.7%, a difference of 0.030%), South African (10.7%, a difference of 0.070%), Immigrants from Hungary (10.7%, a difference of 0.10%), and French (10.7%, a difference of 0.10%).
| Demographics | Rating | Rank | Male Poverty |
| Palestinians | 89.1 /100 | #113 | Excellent 10.6% |
| Immigrants | Brazil | 89.0 /100 | #114 | Excellent 10.6% |
| Immigrants | Russia | 88.6 /100 | #115 | Excellent 10.6% |
| Sri Lankans | 88.1 /100 | #116 | Excellent 10.6% |
| Immigrants | South Eastern Asia | 88.1 /100 | #117 | Excellent 10.6% |
| Okinawans | 87.6 /100 | #118 | Excellent 10.7% |
| Immigrants | Hungary | 87.6 /100 | #119 | Excellent 10.7% |
| Immigrants | China | 87.1 /100 | #120 | Excellent 10.7% |
| Peruvians | 87.1 /100 | #121 | Excellent 10.7% |
| Native Hawaiians | 87.0 /100 | #122 | Excellent 10.7% |
| South Africans | 86.8 /100 | #123 | Excellent 10.7% |
| French | 86.7 /100 | #124 | Excellent 10.7% |
| Immigrants | Norway | 86.0 /100 | #125 | Excellent 10.7% |
| Immigrants | Ukraine | 84.3 /100 | #126 | Excellent 10.7% |
| Puget Sound Salish | 84.3 /100 | #127 | Excellent 10.7% |