Immigrants from Czechoslovakia vs Ghanaian Female Poverty Among 18-24 Year Olds

COMPARE

Immigrants from Czechoslovakia
Race
Ancestry
AfghanAfricanAlaska NativeAlaskan AthabascanAlbanianAleutAlsatianAmericanApacheArabArapahoArgentineanArmenianAssyrian/Chaldean/SyriacAustralianAustrianBahamianBangladeshiBarbadianBasqueBelgianBelizeanBermudanBhutaneseBlackfeetBolivianBrazilianBritishBritish West IndianBulgarianBurmeseCajunCambodianCanadianCape VerdeanCarpatho RusynCelticCentral AmericanCentral American IndianCherokeeCheyenneChickasawChileanChineseChippewaChoctawColombianColvilleComancheCosta RicanCreeCreekCroatianCrowCubanCypriotCzechCzechoslovakianDanishDelawareDominicanDutchDutch West IndianEastern EuropeanEcuadorianEgyptianEnglishEstonianEthiopianEuropeanFijianFilipinoFinnishFrenchFrench American IndianFrench CanadianGermanGerman RussianGreekGuamanian/ChamorroGuatemalanGuyaneseHaitianHmongHonduranHopiHoumaHungarianIcelanderIndian (Asian)IndonesianInupiatIranianIraqiIrishIroquoisIsraeliItalianJamaicanJapaneseJordanianKenyanKiowaKoreanLaotianLatvianLebaneseLiberianLithuanianLumbeeLuxembourgerMacedonianMalaysianMalteseMarshalleseMenomineeMexicanMexican American IndianMongolianMoroccanNative HawaiianNavajoNepaleseNew ZealanderNicaraguanNigerianNorthern EuropeanNorwegianOkinawanOsageOttawaPaiutePakistaniPalestinianPanamanianParaguayanPennsylvania GermanPeruvianPimaPolishPortuguesePotawatomiPuebloPuerto RicanPuget Sound SalishRomanianRussianSalvadoranSamoanScandinavianScotch-IrishScottishSeminoleSenegaleseSerbianShoshoneSierra LeoneanSiouxSlavicSlovakSloveneSomaliSouth AfricanSouth AmericanSouth American IndianSoviet UnionSpaniardSpanishSpanish AmericanSpanish American IndianSri LankanSubsaharan AfricanSudaneseSwedishSwissSyrianTaiwaneseThaiTlingit-HaidaTohono O'OdhamTonganTrinidadian and TobagonianTsimshianTurkishU.S. Virgin IslanderUgandanUkrainianUruguayanUteVenezuelanVietnameseWelshWest IndianYakamaYaquiYugoslavianYumanYup'ikZimbabwean
Immigration
NonimmigrantsImmigrantsAfghanistanAfricaAlbaniaArgentinaArmeniaAsiaAustraliaAustriaBahamasBangladeshBarbadosBelarusBelgiumBelizeBoliviaBosnia and HerzegovinaBrazilBulgariaBurma/MyanmarCabo VerdeCambodiaCameroonCanadaCaribbeanCentral AmericaChileChinaColombiaCongoCosta RicaCroatiaCubaCzechoslovakiaDenmarkDominicaDominican RepublicEastern AfricaEastern AsiaEastern EuropeEcuadorEgyptEl SalvadorEnglandEritreaEthiopiaEuropeFijiFranceGermanyGhanaGreeceGrenadaGuatemalaGuyanaHaitiHondurasHong KongHungaryIndiaIndonesiaIranIraqIrelandIsraelItalyJamaicaJapanJordanKazakhstanKenyaKoreaKuwaitLaosLatin AmericaLatviaLebanonLiberiaLithuaniaMalaysiaMexicoMicronesiaMiddle AfricaMoldovaMoroccoNepalNetherlandsNicaraguaNigeriaNorth AmericaNorth MacedoniaNorthern AfricaNorthern EuropeNorwayOceaniaPakistanPanamaPeruPhilippinesPolandPortugalRomaniaRussiaSaudi ArabiaScotlandSenegalSerbiaSierra LeoneSingaporeSomaliaSouth AfricaSouth AmericaSouth Central AsiaSouth Eastern AsiaSouthern EuropeSpainSri LankaSt. Vincent and the GrenadinesSudanSwedenSwitzerlandSyriaTaiwanThailandTrinidad and TobagoTurkeyUgandaUkraineUruguayUzbekistanVenezuelaVietnamWest IndiesWestern AfricaWestern AsiaWestern EuropeYemenZaireZimbabweAzores
Ghanaian
Race
Ancestry
AfghanAfricanAlaska NativeAlaskan AthabascanAlbanianAleutAlsatianAmericanApacheArabArapahoArgentineanArmenianAssyrian/Chaldean/SyriacAustralianAustrianBahamianBangladeshiBarbadianBasqueBelgianBelizeanBermudanBhutaneseBlackfeetBolivianBrazilianBritishBritish West IndianBulgarianBurmeseCajunCambodianCanadianCape VerdeanCarpatho RusynCelticCentral AmericanCentral American IndianCherokeeCheyenneChickasawChileanChineseChippewaChoctawColombianColvilleComancheCosta RicanCreeCreekCroatianCrowCubanCypriotCzechCzechoslovakianDanishDelawareDominicanDutchDutch West IndianEastern EuropeanEcuadorianEgyptianEnglishEstonianEthiopianEuropeanFijianFilipinoFinnishFrenchFrench American IndianFrench CanadianGermanGerman RussianGhanaianGreekGuamanian/ChamorroGuatemalanGuyaneseHaitianHmongHonduranHopiHoumaHungarianIcelanderIndian (Asian)IndonesianInupiatIranianIraqiIrishIroquoisIsraeliItalianJamaicanJapaneseJordanianKenyanKiowaKoreanLaotianLatvianLebaneseLiberianLithuanianLumbeeLuxembourgerMacedonianMalaysianMalteseMarshalleseMenomineeMexicanMexican American IndianMongolianMoroccanNative HawaiianNavajoNepaleseNew ZealanderNicaraguanNigerianNorthern EuropeanNorwegianOkinawanOsageOttawaPaiutePakistaniPalestinianPanamanianParaguayanPennsylvania GermanPeruvianPimaPolishPortuguesePotawatomiPuebloPuerto RicanPuget Sound SalishRomanianRussianSalvadoranSamoanScandinavianScotch-IrishScottishSeminoleSenegaleseSerbianShoshoneSierra LeoneanSiouxSlavicSlovakSloveneSomaliSouth AfricanSouth AmericanSouth American IndianSoviet UnionSpaniardSpanishSpanish AmericanSpanish American IndianSri LankanSubsaharan AfricanSudaneseSwedishSwissSyrianTaiwaneseThaiTlingit-HaidaTohono O'OdhamTonganTrinidadian and TobagonianTsimshianTurkishU.S. Virgin IslanderUgandanUkrainianUruguayanUteVenezuelanVietnameseWelshWest IndianYakamaYaquiYugoslavianYumanYup'ikZimbabwean
Immigration
NonimmigrantsImmigrantsAfghanistanAfricaAlbaniaArgentinaArmeniaAsiaAustraliaAustriaBahamasBangladeshBarbadosBelarusBelgiumBelizeBoliviaBosnia and HerzegovinaBrazilBulgariaBurma/MyanmarCabo VerdeCambodiaCameroonCanadaCaribbeanCentral AmericaChileChinaColombiaCongoCosta RicaCroatiaCubaDenmarkDominicaDominican RepublicEastern AfricaEastern AsiaEastern EuropeEcuadorEgyptEl SalvadorEnglandEritreaEthiopiaEuropeFijiFranceGermanyGhanaGreeceGrenadaGuatemalaGuyanaHaitiHondurasHong KongHungaryIndiaIndonesiaIranIraqIrelandIsraelItalyJamaicaJapanJordanKazakhstanKenyaKoreaKuwaitLaosLatin AmericaLatviaLebanonLiberiaLithuaniaMalaysiaMexicoMicronesiaMiddle AfricaMoldovaMoroccoNepalNetherlandsNicaraguaNigeriaNorth AmericaNorth MacedoniaNorthern AfricaNorthern EuropeNorwayOceaniaPakistanPanamaPeruPhilippinesPolandPortugalRomaniaRussiaSaudi ArabiaScotlandSenegalSerbiaSierra LeoneSingaporeSomaliaSouth AfricaSouth AmericaSouth Central AsiaSouth Eastern AsiaSouthern EuropeSpainSri LankaSt. Vincent and the GrenadinesSudanSwedenSwitzerlandSyriaTaiwanThailandTrinidad and TobagoTurkeyUgandaUkraineUruguayUzbekistanVenezuelaVietnamWest IndiesWestern AfricaWestern AsiaWestern EuropeYemenZaireZimbabweAzores
Female Poverty Among 18-24 Year Olds
Income
Poverty
Unemployment
Labor Participation
Family Structure
Vehicle Availability
Education Level
Disability

Female Poverty Among 18-24 Year Olds Comparison

Immigrants from Czechoslovakia

Ghanaians

Exceptional
Tragic
19.1%
FEMALE POVERTY AMONG 18-24 YEAR OLDS
98.3/ 100
METRIC RATING
99th/ 347
METRIC RANK
20.8%
FEMALE POVERTY AMONG 18-24 YEAR OLDS
6.5/ 100
METRIC RATING
228th/ 347
METRIC RANK

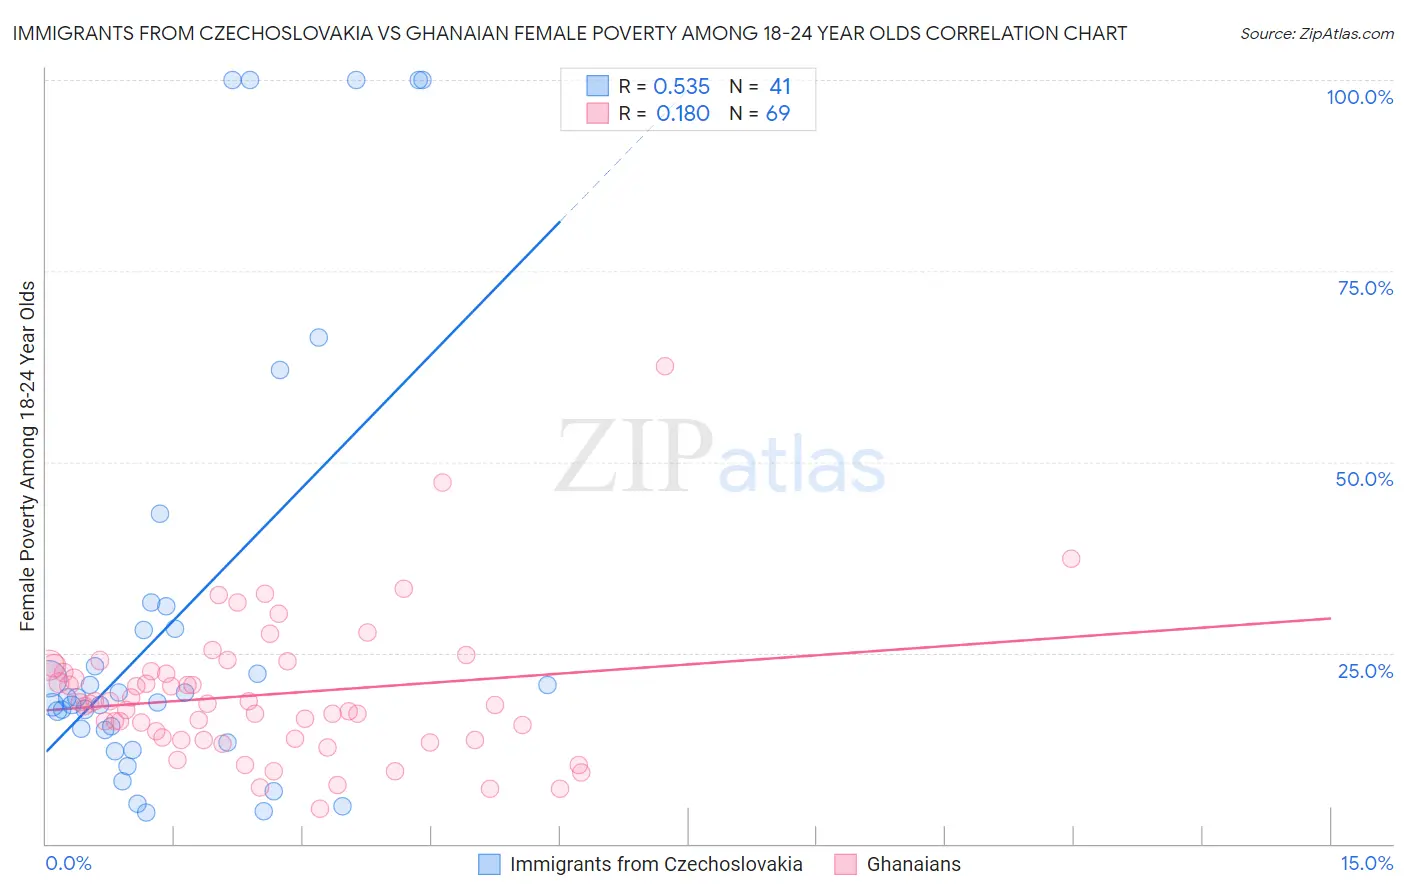
Immigrants from Czechoslovakia vs Ghanaian Female Poverty Among 18-24 Year Olds Correlation Chart

The statistical analysis conducted on geographies consisting of 192,115,244 people shows a substantial positive correlation between the proportion of Immigrants from Czechoslovakia and poverty level among females between the ages 18 and 24 in the United States with a correlation coefficient (R) of 0.535 and weighted average of 19.1%. Similarly, the statistical analysis conducted on geographies consisting of 188,784,310 people shows a poor positive correlation between the proportion of Ghanaians and poverty level among females between the ages 18 and 24 in the United States with a correlation coefficient (R) of 0.180 and weighted average of 20.8%, a difference of 8.6%.
Immigrants from Czechoslovakia vs Ghanaian Female Poverty Among 18-24 Year Olds

Female Poverty Among 18-24 Year Olds Correlation Summary

MeasurementImmigrants from CzechoslovakiaGhanaian
Minimum4.1%4.6%
Maximum100.0%62.5%
Range95.9%57.9%
Mean30.0%19.5%
Median19.1%18.3%
Interquartile 25% (IQ1)14.1%13.6%
Interquartile 75% (IQ3)29.6%22.9%
Interquartile Range (IQR)15.6%9.3%
Standard Deviation (Sample)29.3%9.3%
Standard Deviation (Population)29.0%9.2%

Similar Demographics by Female Poverty Among 18-24 Year Olds

Demographics Similar to Immigrants from Czechoslovakia by Female Poverty Among 18-24 Year Olds

In terms of female poverty among 18-24 year olds, the demographic groups most similar to Immigrants from Czechoslovakia are Chilean (19.1%, a difference of 0.020%), Immigrants from Jordan (19.1%, a difference of 0.070%), Salvadoran (19.1%, a difference of 0.080%), Ecuadorian (19.1%, a difference of 0.11%), and Immigrants from Caribbean (19.1%, a difference of 0.13%).
DemographicsRating | RankFemale Poverty Among 18-24 Year Olds
Filipinos
98.9
/100
|
#92
Exceptional
19.0%
Haitians
98.9
/100
|
#93
Exceptional
19.0%
Ukrainians
98.8
/100
|
#94
Exceptional
19.0%
Guamanians/Chamorros
98.8
/100
|
#95
Exceptional
19.0%
Sierra Leoneans
98.7
/100
|
#96
Exceptional
19.0%
Salvadorans
98.4
/100
|
#97
Exceptional
19.1%
Immigrants | Jordan
98.4
/100
|
#98
Exceptional
19.1%
Immigrants | Czechoslovakia
98.3
/100
|
#99
Exceptional
19.1%
Chileans
98.3
/100
|
#100
Exceptional
19.1%
Ecuadorians
98.1
/100
|
#101
Exceptional
19.1%
Immigrants | Caribbean
98.1
/100
|
#102
Exceptional
19.1%
Serbians
98.0
/100
|
#103
Exceptional
19.1%
Immigrants | Afghanistan
98.0
/100
|
#104
Exceptional
19.1%
Immigrants | Ecuador
97.8
/100
|
#105
Exceptional
19.2%
Immigrants | Sierra Leone
97.8
/100
|
#106
Exceptional
19.2%

Demographics Similar to Ghanaians by Female Poverty Among 18-24 Year Olds

In terms of female poverty among 18-24 year olds, the demographic groups most similar to Ghanaians are Immigrants from Sweden (20.7%, a difference of 0.060%), Australian (20.8%, a difference of 0.070%), White/Caucasian (20.8%, a difference of 0.070%), Immigrants from St. Vincent and the Grenadines (20.8%, a difference of 0.090%), and Finnish (20.8%, a difference of 0.10%).
DemographicsRating | RankFemale Poverty Among 18-24 Year Olds
Barbadians
9.0
/100
|
#221
Tragic
20.7%
Guatemalans
8.1
/100
|
#222
Tragic
20.7%
French
7.9
/100
|
#223
Tragic
20.7%
Immigrants | Liberia
7.6
/100
|
#224
Tragic
20.7%
Norwegians
7.3
/100
|
#225
Tragic
20.7%
Estonians
7.2
/100
|
#226
Tragic
20.7%
Immigrants | Sweden
6.8
/100
|
#227
Tragic
20.7%
Ghanaians
6.5
/100
|
#228
Tragic
20.8%
Australians
6.1
/100
|
#229
Tragic
20.8%
Whites/Caucasians
6.1
/100
|
#230
Tragic
20.8%
Immigrants | St. Vincent and the Grenadines
6.0
/100
|
#231
Tragic
20.8%
Finns
6.0
/100
|
#232
Tragic
20.8%
Immigrants | Denmark
5.8
/100
|
#233
Tragic
20.8%
Welsh
5.4
/100
|
#234
Tragic
20.8%
Immigrants | Uganda
5.1
/100
|
#235
Tragic
20.8%