Korean vs Immigrants from Morocco Married-Couple Family Poverty
COMPARE
Korean
Immigrants from Morocco
Married-Couple Family Poverty
Married-Couple Family Poverty Comparison
Koreans
Immigrants from Morocco
4.6%
MARRIED-COUPLE FAMILY POVERTY
98.3/ 100
METRIC RATING
93rd/ 347
METRIC RANK
5.4%
MARRIED-COUPLE FAMILY POVERTY
24.3/ 100
METRIC RATING
200th/ 347
METRIC RANK
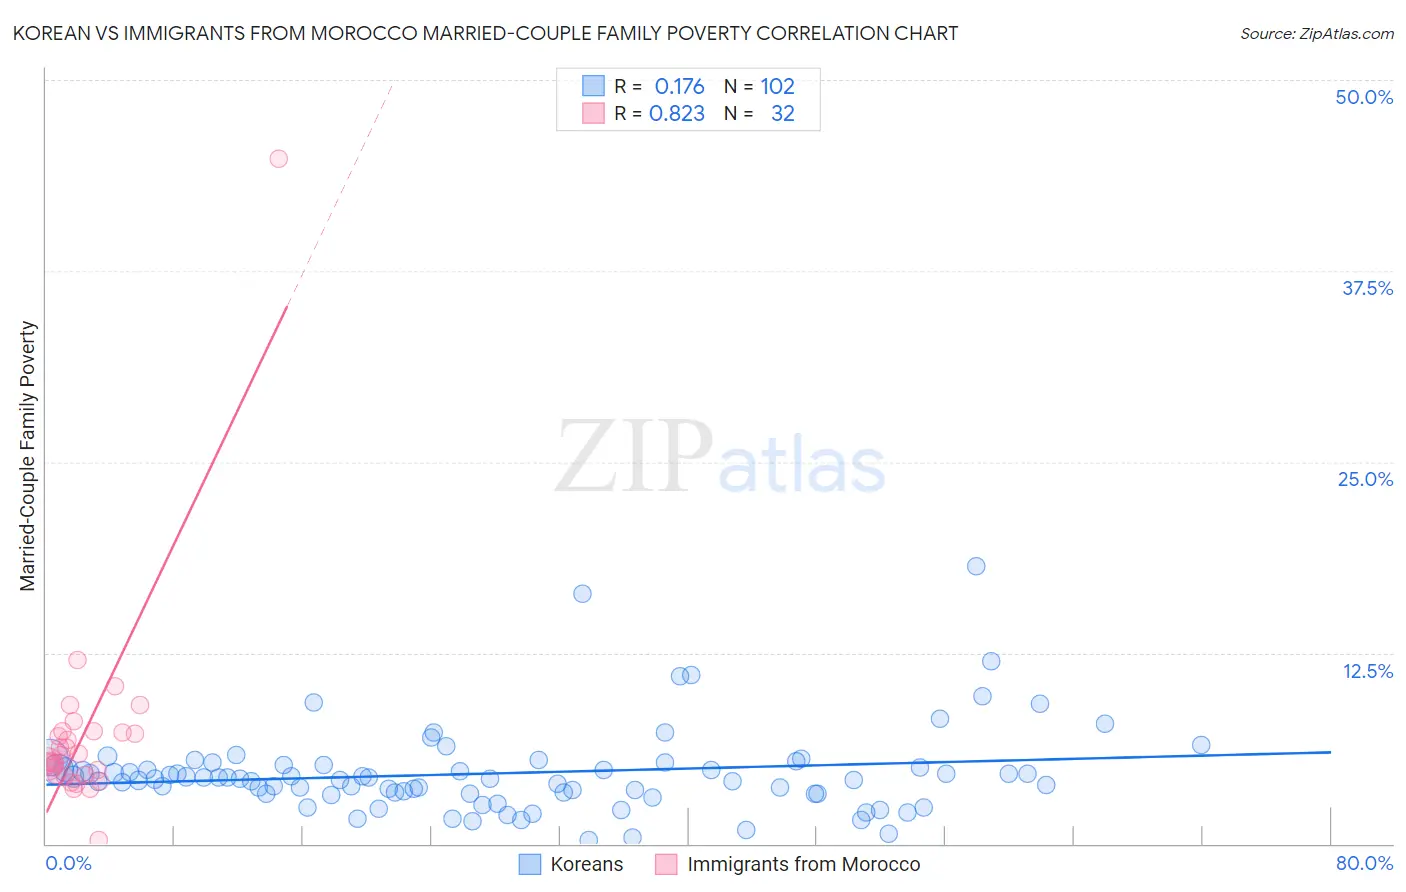
Korean vs Immigrants from Morocco Married-Couple Family Poverty Correlation Chart
The statistical analysis conducted on geographies consisting of 503,402,719 people shows a poor positive correlation between the proportion of Koreans and poverty level among married-couple families in the United States with a correlation coefficient (R) of 0.176 and weighted average of 4.6%. Similarly, the statistical analysis conducted on geographies consisting of 178,420,133 people shows a very strong positive correlation between the proportion of Immigrants from Morocco and poverty level among married-couple families in the United States with a correlation coefficient (R) of 0.823 and weighted average of 5.4%, a difference of 17.2%.
Married-Couple Family Poverty Correlation Summary
| Measurement | Korean | Immigrants from Morocco |
| Minimum | 0.27% | 0.27% |
| Maximum | 18.2% | 44.8% |
| Range | 17.9% | 44.6% |
| Mean | 4.6% | 7.2% |
| Median | 4.3% | 5.6% |
| Interquartile 25% (IQ1) | 3.3% | 4.5% |
| Interquartile 75% (IQ3) | 5.1% | 7.3% |
| Interquartile Range (IQR) | 1.8% | 2.8% |
| Standard Deviation (Sample) | 2.8% | 7.2% |
| Standard Deviation (Population) | 2.8% | 7.1% |
Similar Demographics by Married-Couple Family Poverty
Demographics Similar to Koreans by Married-Couple Family Poverty
In terms of married-couple family poverty, the demographic groups most similar to Koreans are Immigrants from Italy (4.6%, a difference of 0.050%), Portuguese (4.6%, a difference of 0.090%), Immigrants from Poland (4.6%, a difference of 0.17%), Immigrants from Norway (4.6%, a difference of 0.18%), and Immigrants from Belgium (4.6%, a difference of 0.22%).
| Demographics | Rating | Rank | Married-Couple Family Poverty |
| Immigrants | Turkey | 98.6 /100 | #86 | Exceptional 4.6% |
| Immigrants | North Macedonia | 98.6 /100 | #87 | Exceptional 4.6% |
| Bolivians | 98.6 /100 | #88 | Exceptional 4.6% |
| Immigrants | Czechoslovakia | 98.5 /100 | #89 | Exceptional 4.6% |
| Immigrants | Switzerland | 98.5 /100 | #90 | Exceptional 4.6% |
| Basques | 98.5 /100 | #91 | Exceptional 4.6% |
| Immigrants | Norway | 98.4 /100 | #92 | Exceptional 4.6% |
| Koreans | 98.3 /100 | #93 | Exceptional 4.6% |
| Immigrants | Italy | 98.3 /100 | #94 | Exceptional 4.6% |
| Portuguese | 98.3 /100 | #95 | Exceptional 4.6% |
| Immigrants | Poland | 98.3 /100 | #96 | Exceptional 4.6% |
| Immigrants | Belgium | 98.2 /100 | #97 | Exceptional 4.6% |
| Native Hawaiians | 98.0 /100 | #98 | Exceptional 4.6% |
| Immigrants | Europe | 97.9 /100 | #99 | Exceptional 4.6% |
| Immigrants | Western Europe | 97.9 /100 | #100 | Exceptional 4.6% |
Demographics Similar to Immigrants from Morocco by Married-Couple Family Poverty
In terms of married-couple family poverty, the demographic groups most similar to Immigrants from Morocco are Lebanese (5.4%, a difference of 0.020%), Immigrants from Middle Africa (5.4%, a difference of 0.080%), Uruguayan (5.4%, a difference of 0.11%), Immigrants from Belarus (5.4%, a difference of 0.29%), and Liberian (5.4%, a difference of 0.31%).
| Demographics | Rating | Rank | Married-Couple Family Poverty |
| Malaysians | 29.5 /100 | #193 | Fair 5.4% |
| Immigrants | Israel | 27.8 /100 | #194 | Fair 5.4% |
| Immigrants | Azores | 27.5 /100 | #195 | Fair 5.4% |
| Spaniards | 27.4 /100 | #196 | Fair 5.4% |
| Liberians | 26.3 /100 | #197 | Fair 5.4% |
| Immigrants | Belarus | 26.2 /100 | #198 | Fair 5.4% |
| Uruguayans | 25.0 /100 | #199 | Fair 5.4% |
| Immigrants | Morocco | 24.3 /100 | #200 | Fair 5.4% |
| Lebanese | 24.1 /100 | #201 | Fair 5.4% |
| Immigrants | Middle Africa | 23.8 /100 | #202 | Fair 5.4% |
| Immigrants | Peru | 21.8 /100 | #203 | Fair 5.4% |
| Immigrants | Costa Rica | 19.4 /100 | #204 | Poor 5.4% |
| Chippewa | 18.9 /100 | #205 | Poor 5.4% |
| Osage | 18.4 /100 | #206 | Poor 5.4% |
| Immigrants | Africa | 17.6 /100 | #207 | Poor 5.5% |