Choctaw vs Immigrants from Colombia Family Poverty
COMPARE
Choctaw
Immigrants from Colombia
Family Poverty
Family Poverty Comparison
Choctaw
Immigrants from Colombia
11.6%
FAMILY POVERTY
0.0/ 100
METRIC RATING
296th/ 347
METRIC RANK
9.3%
FAMILY POVERTY
24.4/ 100
METRIC RATING
197th/ 347
METRIC RANK
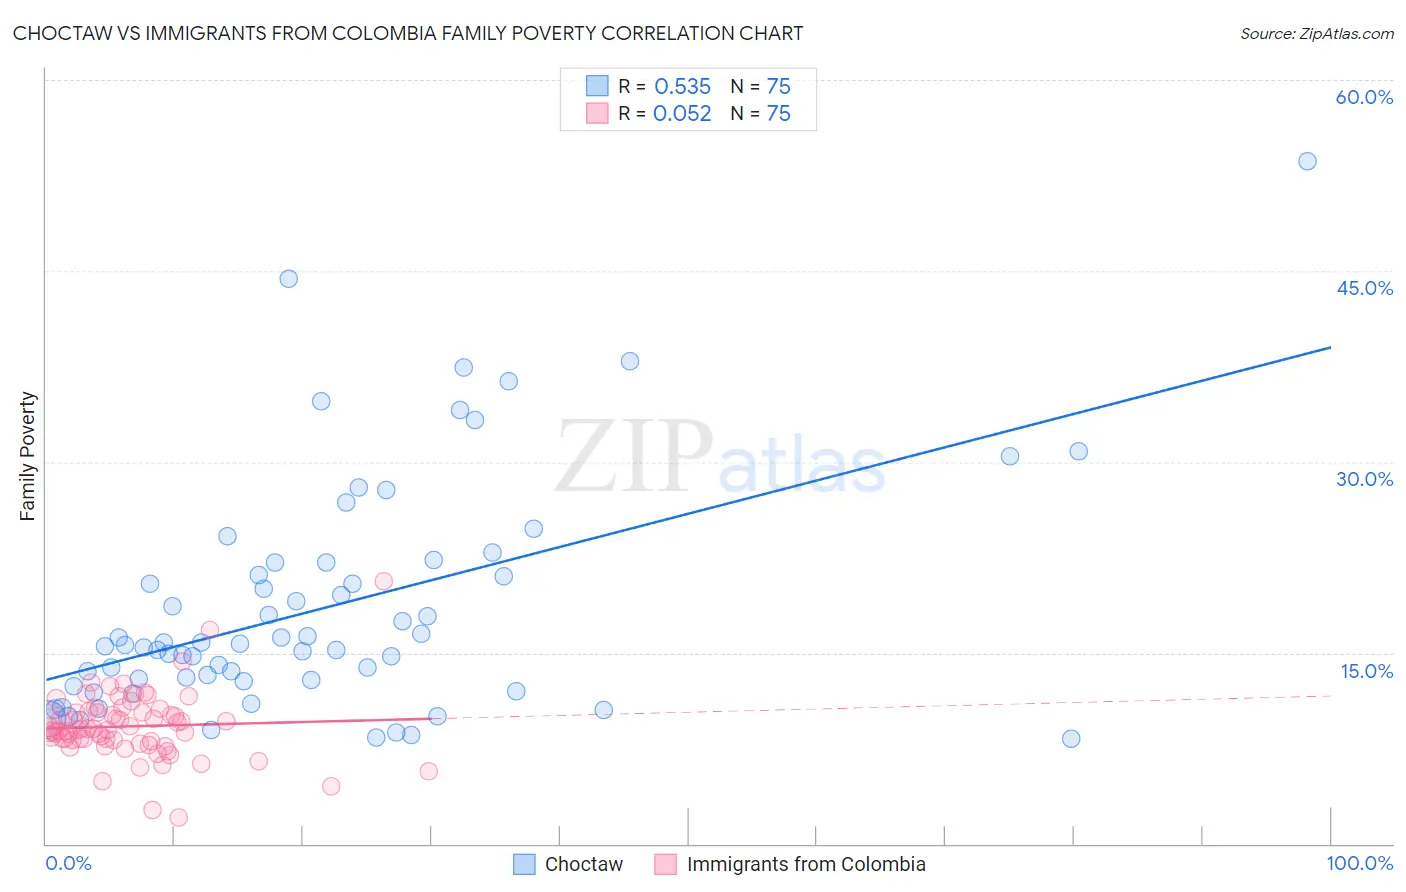
Choctaw vs Immigrants from Colombia Family Poverty Correlation Chart
The statistical analysis conducted on geographies consisting of 269,406,006 people shows a substantial positive correlation between the proportion of Choctaw and poverty level among families in the United States with a correlation coefficient (R) of 0.535 and weighted average of 11.6%. Similarly, the statistical analysis conducted on geographies consisting of 377,791,823 people shows a slight positive correlation between the proportion of Immigrants from Colombia and poverty level among families in the United States with a correlation coefficient (R) of 0.052 and weighted average of 9.3%, a difference of 24.5%.
Family Poverty Correlation Summary
| Measurement | Choctaw | Immigrants from Colombia |
| Minimum | 8.2% | 2.1% |
| Maximum | 53.6% | 20.6% |
| Range | 45.4% | 18.5% |
| Mean | 18.5% | 9.2% |
| Median | 15.6% | 8.9% |
| Interquartile 25% (IQ1) | 12.7% | 8.1% |
| Interquartile 75% (IQ3) | 22.1% | 10.3% |
| Interquartile Range (IQR) | 9.3% | 2.3% |
| Standard Deviation (Sample) | 9.0% | 2.7% |
| Standard Deviation (Population) | 9.0% | 2.7% |
Similar Demographics by Family Poverty
Demographics Similar to Choctaw by Family Poverty
In terms of family poverty, the demographic groups most similar to Choctaw are Immigrants from Haiti (11.6%, a difference of 0.050%), Immigrants from St. Vincent and the Grenadines (11.6%, a difference of 0.17%), Creek (11.7%, a difference of 0.23%), Immigrants from Cabo Verde (11.6%, a difference of 0.25%), and Immigrants from Senegal (11.7%, a difference of 0.37%).
| Demographics | Rating | Rank | Family Poverty |
| Immigrants | Barbados | 0.0 /100 | #289 | Tragic 11.5% |
| West Indians | 0.0 /100 | #290 | Tragic 11.5% |
| Haitians | 0.0 /100 | #291 | Tragic 11.5% |
| Immigrants | Somalia | 0.0 /100 | #292 | Tragic 11.5% |
| Immigrants | Cabo Verde | 0.0 /100 | #293 | Tragic 11.6% |
| Immigrants | St. Vincent and the Grenadines | 0.0 /100 | #294 | Tragic 11.6% |
| Immigrants | Haiti | 0.0 /100 | #295 | Tragic 11.6% |
| Choctaw | 0.0 /100 | #296 | Tragic 11.6% |
| Creek | 0.0 /100 | #297 | Tragic 11.7% |
| Immigrants | Senegal | 0.0 /100 | #298 | Tragic 11.7% |
| Dutch West Indians | 0.0 /100 | #299 | Tragic 11.7% |
| Immigrants | Bangladesh | 0.0 /100 | #300 | Tragic 11.7% |
| Bahamians | 0.0 /100 | #301 | Tragic 11.7% |
| Guatemalans | 0.0 /100 | #302 | Tragic 11.7% |
| Africans | 0.0 /100 | #303 | Tragic 11.8% |
Demographics Similar to Immigrants from Colombia by Family Poverty
In terms of family poverty, the demographic groups most similar to Immigrants from Colombia are Iraqi (9.3%, a difference of 0.030%), Spaniard (9.4%, a difference of 0.28%), Immigrants from Venezuela (9.3%, a difference of 0.29%), Immigrants from Costa Rica (9.4%, a difference of 0.47%), and Venezuelan (9.3%, a difference of 0.50%).
| Demographics | Rating | Rank | Family Poverty |
| Arabs | 31.5 /100 | #190 | Fair 9.2% |
| Ugandans | 28.7 /100 | #191 | Fair 9.3% |
| Spanish | 28.7 /100 | #192 | Fair 9.3% |
| Immigrants | Western Asia | 28.2 /100 | #193 | Fair 9.3% |
| South Americans | 28.1 /100 | #194 | Fair 9.3% |
| Venezuelans | 27.4 /100 | #195 | Fair 9.3% |
| Immigrants | Venezuela | 26.1 /100 | #196 | Fair 9.3% |
| Immigrants | Colombia | 24.4 /100 | #197 | Fair 9.3% |
| Iraqis | 24.2 /100 | #198 | Fair 9.3% |
| Spaniards | 22.8 /100 | #199 | Fair 9.4% |
| Immigrants | Costa Rica | 21.7 /100 | #200 | Fair 9.4% |
| Immigrants | Portugal | 20.5 /100 | #201 | Fair 9.4% |
| Immigrants | Sierra Leone | 19.6 /100 | #202 | Poor 9.4% |
| German Russians | 19.4 /100 | #203 | Poor 9.4% |
| Immigrants | Lebanon | 18.9 /100 | #204 | Poor 9.4% |