Jamaican vs Immigrants from Kuwait Median Family Income
COMPARE
Jamaican
Immigrants from Kuwait
Median Family Income
Median Family Income Comparison
Jamaicans
Immigrants from Kuwait
$90,581
MEDIAN FAMILY INCOME
0.2/ 100
METRIC RATING
270th/ 347
METRIC RANK
$109,731
MEDIAN FAMILY INCOME
97.4/ 100
METRIC RATING
98th/ 347
METRIC RANK
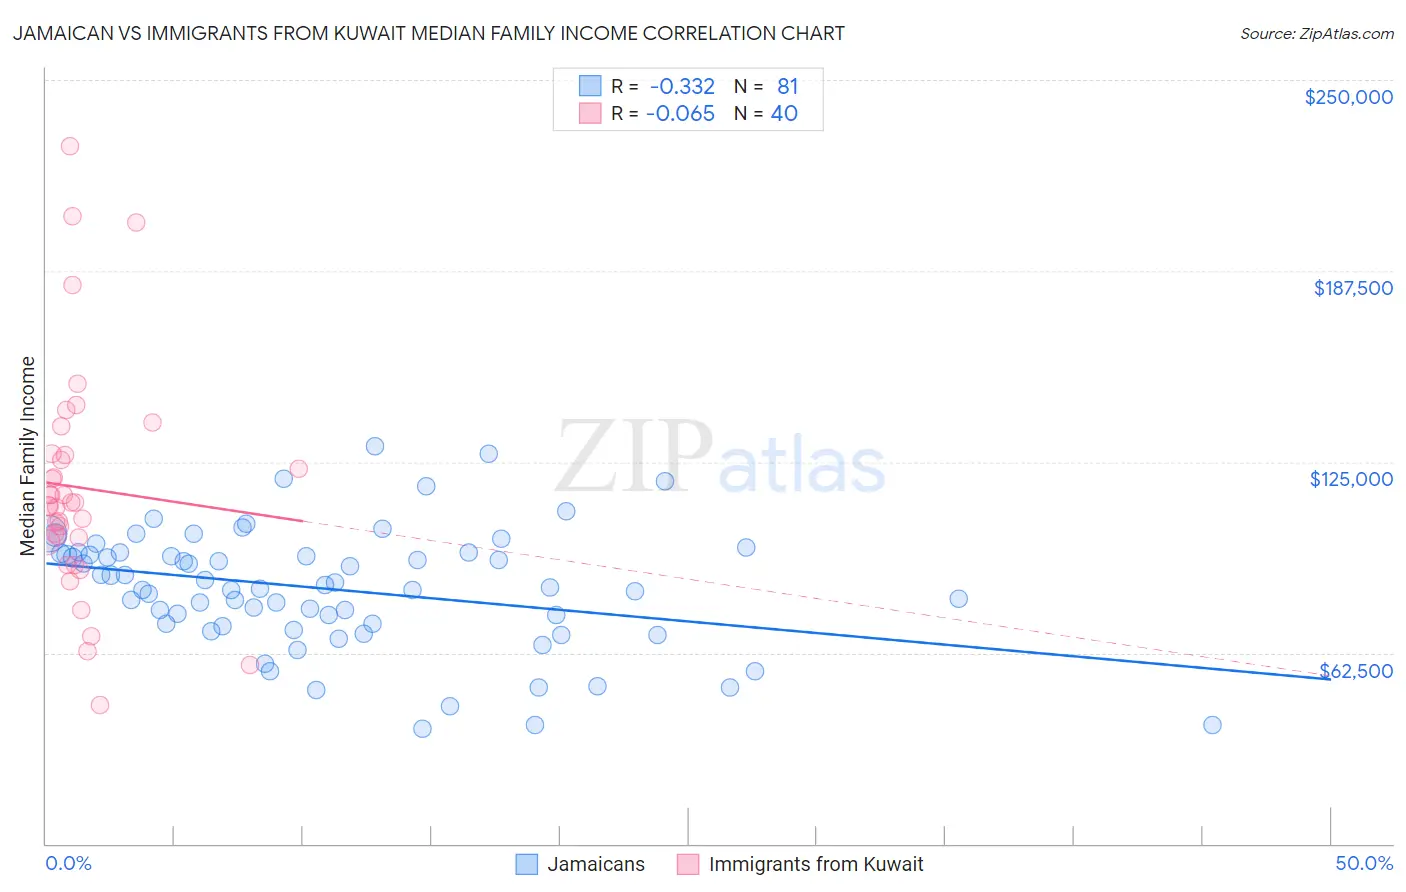
Jamaican vs Immigrants from Kuwait Median Family Income Correlation Chart
The statistical analysis conducted on geographies consisting of 367,485,053 people shows a mild negative correlation between the proportion of Jamaicans and median family income in the United States with a correlation coefficient (R) of -0.332 and weighted average of $90,581. Similarly, the statistical analysis conducted on geographies consisting of 136,880,543 people shows a slight negative correlation between the proportion of Immigrants from Kuwait and median family income in the United States with a correlation coefficient (R) of -0.065 and weighted average of $109,731, a difference of 21.1%.
Median Family Income Correlation Summary
| Measurement | Jamaican | Immigrants from Kuwait |
| Minimum | $37,461 | $45,469 |
| Maximum | $130,066 | $228,438 |
| Range | $92,605 | $182,969 |
| Mean | $83,374 | $116,543 |
| Median | $84,019 | $111,085 |
| Interquartile 25% (IQ1) | $71,528 | $99,414 |
| Interquartile 75% (IQ3) | $95,163 | $127,464 |
| Interquartile Range (IQR) | $23,635 | $28,050 |
| Standard Deviation (Sample) | $19,598 | $37,905 |
| Standard Deviation (Population) | $19,477 | $37,428 |
Similar Demographics by Median Family Income
Demographics Similar to Jamaicans by Median Family Income
In terms of median family income, the demographic groups most similar to Jamaicans are Iroquois ($90,543, a difference of 0.040%), Immigrants from Liberia ($90,450, a difference of 0.14%), Immigrants from Micronesia ($90,345, a difference of 0.26%), Spanish American ($90,322, a difference of 0.29%), and Cree ($90,882, a difference of 0.33%).
| Demographics | Rating | Rank | Median Family Income |
| Immigrants | West Indies | 0.3 /100 | #263 | Tragic $91,588 |
| Senegalese | 0.3 /100 | #264 | Tragic $91,475 |
| Hmong | 0.3 /100 | #265 | Tragic $91,296 |
| Central Americans | 0.3 /100 | #266 | Tragic $91,087 |
| Mexican American Indians | 0.2 /100 | #267 | Tragic $90,918 |
| Cree | 0.2 /100 | #268 | Tragic $90,882 |
| Belizeans | 0.2 /100 | #269 | Tragic $90,880 |
| Jamaicans | 0.2 /100 | #270 | Tragic $90,581 |
| Iroquois | 0.2 /100 | #271 | Tragic $90,543 |
| Immigrants | Liberia | 0.2 /100 | #272 | Tragic $90,450 |
| Immigrants | Micronesia | 0.2 /100 | #273 | Tragic $90,345 |
| Spanish Americans | 0.2 /100 | #274 | Tragic $90,322 |
| Immigrants | St. Vincent and the Grenadines | 0.2 /100 | #275 | Tragic $90,094 |
| Immigrants | Zaire | 0.1 /100 | #276 | Tragic $89,285 |
| Immigrants | Jamaica | 0.1 /100 | #277 | Tragic $89,268 |
Demographics Similar to Immigrants from Kuwait by Median Family Income
In terms of median family income, the demographic groups most similar to Immigrants from Kuwait are Armenian ($109,692, a difference of 0.040%), Macedonian ($109,668, a difference of 0.060%), Immigrants from Ukraine ($109,645, a difference of 0.080%), Assyrian/Chaldean/Syriac ($109,622, a difference of 0.10%), and Jordanian ($109,865, a difference of 0.12%).
| Demographics | Rating | Rank | Median Family Income |
| Immigrants | Southern Europe | 98.3 /100 | #91 | Exceptional $110,614 |
| Immigrants | Lebanon | 97.9 /100 | #92 | Exceptional $110,159 |
| Immigrants | Kazakhstan | 97.8 /100 | #93 | Exceptional $110,137 |
| Koreans | 97.8 /100 | #94 | Exceptional $110,103 |
| Zimbabweans | 97.7 /100 | #95 | Exceptional $110,011 |
| Immigrants | Moldova | 97.7 /100 | #96 | Exceptional $109,975 |
| Jordanians | 97.5 /100 | #97 | Exceptional $109,865 |
| Immigrants | Kuwait | 97.4 /100 | #98 | Exceptional $109,731 |
| Armenians | 97.3 /100 | #99 | Exceptional $109,692 |
| Macedonians | 97.3 /100 | #100 | Exceptional $109,668 |
| Immigrants | Ukraine | 97.2 /100 | #101 | Exceptional $109,645 |
| Assyrians/Chaldeans/Syriacs | 97.2 /100 | #102 | Exceptional $109,622 |
| Immigrants | Brazil | 96.9 /100 | #103 | Exceptional $109,418 |
| Palestinians | 96.9 /100 | #104 | Exceptional $109,413 |
| Syrians | 96.7 /100 | #105 | Exceptional $109,299 |