Immigrants from Africa vs Immigrants from Liberia Single Father Poverty
COMPARE
Immigrants from Africa
Immigrants from Liberia
Single Father Poverty
Single Father Poverty Comparison
Immigrants from Africa
Immigrants from Liberia
15.8%
SINGLE FATHER POVERTY
95.1/ 100
METRIC RATING
110th/ 347
METRIC RANK
15.9%
SINGLE FATHER POVERTY
91.1/ 100
METRIC RATING
127th/ 347
METRIC RANK
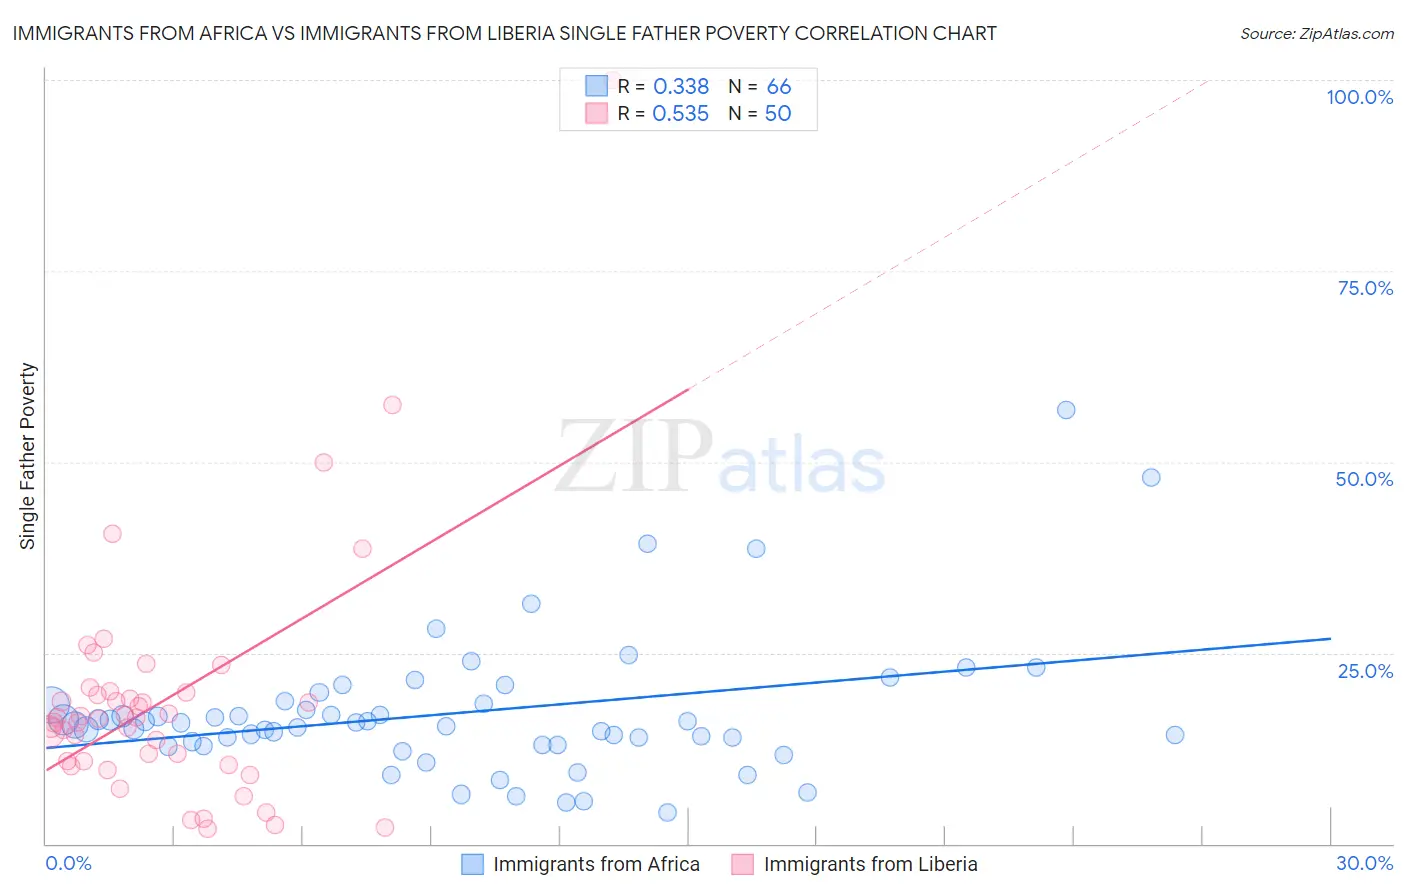
Immigrants from Africa vs Immigrants from Liberia Single Father Poverty Correlation Chart
The statistical analysis conducted on geographies consisting of 360,154,757 people shows a mild positive correlation between the proportion of Immigrants from Africa and poverty level among single fathers in the United States with a correlation coefficient (R) of 0.338 and weighted average of 15.8%. Similarly, the statistical analysis conducted on geographies consisting of 122,784,105 people shows a substantial positive correlation between the proportion of Immigrants from Liberia and poverty level among single fathers in the United States with a correlation coefficient (R) of 0.535 and weighted average of 15.9%, a difference of 0.72%.
Single Father Poverty Correlation Summary
| Measurement | Immigrants from Africa | Immigrants from Liberia |
| Minimum | 4.1% | 2.0% |
| Maximum | 56.8% | 100.0% |
| Range | 52.7% | 98.0% |
| Mean | 17.1% | 18.7% |
| Median | 15.7% | 16.5% |
| Interquartile 25% (IQ1) | 13.0% | 10.8% |
| Interquartile 75% (IQ3) | 18.3% | 19.8% |
| Interquartile Range (IQR) | 5.3% | 9.0% |
| Standard Deviation (Sample) | 9.1% | 16.1% |
| Standard Deviation (Population) | 9.0% | 15.9% |
Demographics Similar to Immigrants from Africa and Immigrants from Liberia by Single Father Poverty
In terms of single father poverty, the demographic groups most similar to Immigrants from Africa are Turkish (15.8%, a difference of 0.010%), Bulgarian (15.8%, a difference of 0.050%), Immigrants from Latvia (15.8%, a difference of 0.080%), Danish (15.8%, a difference of 0.13%), and Argentinean (15.8%, a difference of 0.14%). Similarly, the demographic groups most similar to Immigrants from Liberia are Hmong (15.9%, a difference of 0.010%), Iraqi (15.9%, a difference of 0.020%), Immigrants from Panama (15.9%, a difference of 0.030%), Immigrants from Nigeria (15.9%, a difference of 0.030%), and Palestinian (15.9%, a difference of 0.040%).
| Demographics | Rating | Rank | Single Father Poverty |
| Pakistanis | 95.7 /100 | #108 | Exceptional 15.7% |
| Turks | 95.1 /100 | #109 | Exceptional 15.8% |
| Immigrants | Africa | 95.1 /100 | #110 | Exceptional 15.8% |
| Bulgarians | 94.8 /100 | #111 | Exceptional 15.8% |
| Immigrants | Latvia | 94.7 /100 | #112 | Exceptional 15.8% |
| Danes | 94.5 /100 | #113 | Exceptional 15.8% |
| Argentineans | 94.4 /100 | #114 | Exceptional 15.8% |
| Immigrants | Thailand | 93.6 /100 | #115 | Exceptional 15.8% |
| Immigrants | Argentina | 92.8 /100 | #116 | Exceptional 15.8% |
| Immigrants | Colombia | 92.6 /100 | #117 | Exceptional 15.8% |
| Immigrants | Eastern Europe | 92.5 /100 | #118 | Exceptional 15.8% |
| Immigrants | Belarus | 92.4 /100 | #119 | Exceptional 15.8% |
| Uruguayans | 92.1 /100 | #120 | Exceptional 15.9% |
| Immigrants | Immigrants | 91.9 /100 | #121 | Exceptional 15.9% |
| Sudanese | 91.6 /100 | #122 | Exceptional 15.9% |
| Palestinians | 91.3 /100 | #123 | Exceptional 15.9% |
| Immigrants | Panama | 91.3 /100 | #124 | Exceptional 15.9% |
| Iraqis | 91.2 /100 | #125 | Exceptional 15.9% |
| Hmong | 91.1 /100 | #126 | Exceptional 15.9% |
| Immigrants | Liberia | 91.1 /100 | #127 | Exceptional 15.9% |
| Immigrants | Nigeria | 90.8 /100 | #128 | Exceptional 15.9% |