Immigrants from Scotland vs Marshallese Poverty
COMPARE
Immigrants from Scotland
Marshallese
Poverty
Poverty Comparison
Immigrants from Scotland
Marshallese
10.6%
POVERTY
99.7/ 100
METRIC RATING
19th/ 347
METRIC RANK
13.4%
POVERTY
2.2/ 100
METRIC RATING
226th/ 347
METRIC RANK
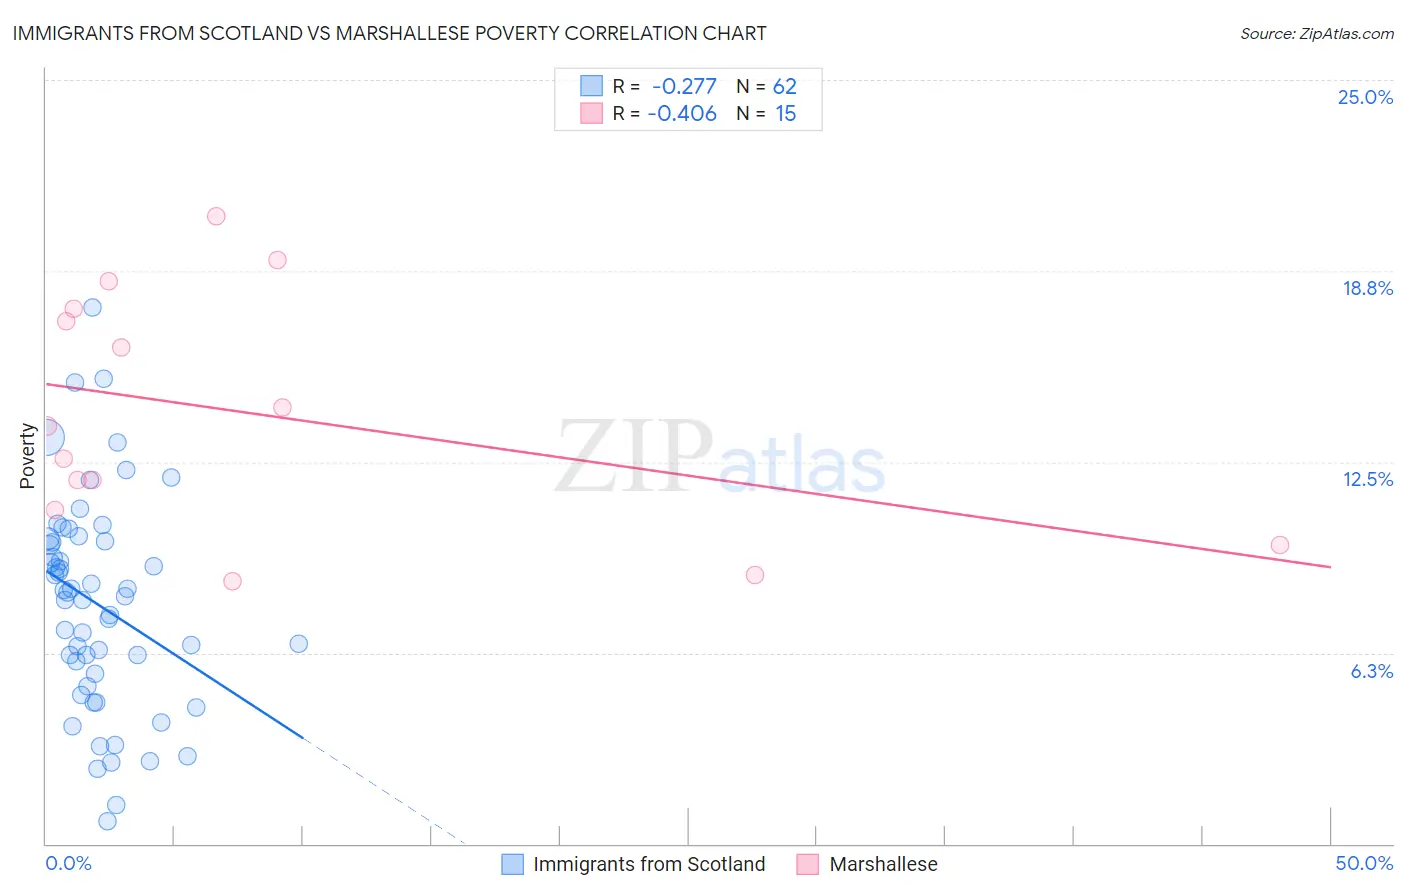
Immigrants from Scotland vs Marshallese Poverty Correlation Chart
The statistical analysis conducted on geographies consisting of 196,384,756 people shows a weak negative correlation between the proportion of Immigrants from Scotland and poverty level in the United States with a correlation coefficient (R) of -0.277 and weighted average of 10.6%. Similarly, the statistical analysis conducted on geographies consisting of 14,760,991 people shows a moderate negative correlation between the proportion of Marshallese and poverty level in the United States with a correlation coefficient (R) of -0.406 and weighted average of 13.4%, a difference of 27.4%.
Poverty Correlation Summary
| Measurement | Immigrants from Scotland | Marshallese |
| Minimum | 0.74% | 8.6% |
| Maximum | 17.6% | 20.5% |
| Range | 16.8% | 12.0% |
| Mean | 7.8% | 14.1% |
| Median | 8.2% | 13.7% |
| Interquartile 25% (IQ1) | 5.6% | 10.9% |
| Interquartile 75% (IQ3) | 9.9% | 17.5% |
| Interquartile Range (IQR) | 4.4% | 6.6% |
| Standard Deviation (Sample) | 3.5% | 3.9% |
| Standard Deviation (Population) | 3.4% | 3.7% |
Similar Demographics by Poverty
Demographics Similar to Immigrants from Scotland by Poverty
In terms of poverty, the demographic groups most similar to Immigrants from Scotland are Immigrants from North Macedonia (10.6%, a difference of 0.11%), Luxembourger (10.6%, a difference of 0.19%), Eastern European (10.6%, a difference of 0.35%), Latvian (10.5%, a difference of 0.39%), and Swedish (10.6%, a difference of 0.46%).
| Demographics | Rating | Rank | Poverty |
| Bhutanese | 99.8 /100 | #12 | Exceptional 10.4% |
| Immigrants | Hong Kong | 99.8 /100 | #13 | Exceptional 10.4% |
| Immigrants | Bolivia | 99.8 /100 | #14 | Exceptional 10.4% |
| Bolivians | 99.8 /100 | #15 | Exceptional 10.4% |
| Lithuanians | 99.8 /100 | #16 | Exceptional 10.5% |
| Norwegians | 99.8 /100 | #17 | Exceptional 10.5% |
| Latvians | 99.8 /100 | #18 | Exceptional 10.5% |
| Immigrants | Scotland | 99.7 /100 | #19 | Exceptional 10.6% |
| Immigrants | North Macedonia | 99.7 /100 | #20 | Exceptional 10.6% |
| Luxembourgers | 99.7 /100 | #21 | Exceptional 10.6% |
| Eastern Europeans | 99.7 /100 | #22 | Exceptional 10.6% |
| Swedes | 99.7 /100 | #23 | Exceptional 10.6% |
| Italians | 99.7 /100 | #24 | Exceptional 10.6% |
| Croatians | 99.6 /100 | #25 | Exceptional 10.6% |
| Burmese | 99.6 /100 | #26 | Exceptional 10.7% |
Demographics Similar to Marshallese by Poverty
In terms of poverty, the demographic groups most similar to Marshallese are German Russian (13.4%, a difference of 0.010%), Alaska Native (13.5%, a difference of 0.15%), Immigrants from Eritrea (13.4%, a difference of 0.23%), Immigrants from Africa (13.4%, a difference of 0.33%), and Immigrants from Micronesia (13.4%, a difference of 0.36%).
| Demographics | Rating | Rank | Poverty |
| Immigrants | Cambodia | 3.0 /100 | #219 | Tragic 13.4% |
| Americans | 2.9 /100 | #220 | Tragic 13.4% |
| Alsatians | 2.6 /100 | #221 | Tragic 13.4% |
| Immigrants | Micronesia | 2.6 /100 | #222 | Tragic 13.4% |
| Immigrants | Africa | 2.5 /100 | #223 | Tragic 13.4% |
| Immigrants | Eritrea | 2.4 /100 | #224 | Tragic 13.4% |
| German Russians | 2.2 /100 | #225 | Tragic 13.4% |
| Marshallese | 2.2 /100 | #226 | Tragic 13.4% |
| Alaska Natives | 2.1 /100 | #227 | Tragic 13.5% |
| Immigrants | Nigeria | 1.7 /100 | #228 | Tragic 13.5% |
| Osage | 1.5 /100 | #229 | Tragic 13.6% |
| Alaskan Athabascans | 1.5 /100 | #230 | Tragic 13.6% |
| Nigerians | 1.4 /100 | #231 | Tragic 13.6% |
| Fijians | 0.8 /100 | #232 | Tragic 13.7% |
| Immigrants | Saudi Arabia | 0.8 /100 | #233 | Tragic 13.8% |