Immigrants from Scotland vs Immigrants from Pakistan Poverty
COMPARE
Immigrants from Scotland
Immigrants from Pakistan
Poverty
Poverty Comparison
Immigrants from Scotland
Immigrants from Pakistan
10.6%
POVERTY
99.7/ 100
METRIC RATING
19th/ 347
METRIC RANK
10.8%
POVERTY
99.3/ 100
METRIC RATING
39th/ 347
METRIC RANK
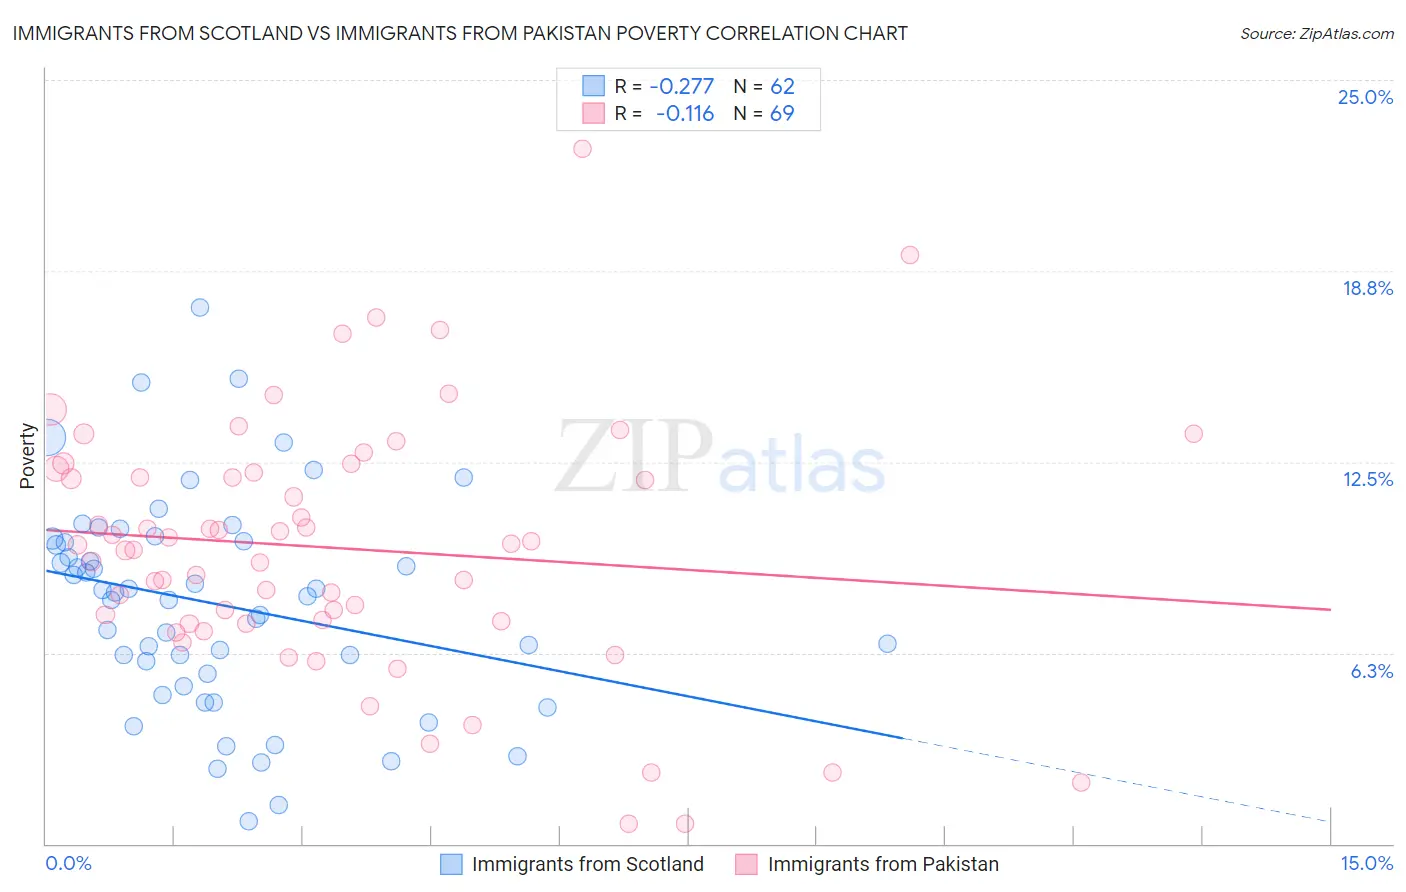
Immigrants from Scotland vs Immigrants from Pakistan Poverty Correlation Chart
The statistical analysis conducted on geographies consisting of 196,384,756 people shows a weak negative correlation between the proportion of Immigrants from Scotland and poverty level in the United States with a correlation coefficient (R) of -0.277 and weighted average of 10.6%. Similarly, the statistical analysis conducted on geographies consisting of 283,811,993 people shows a poor negative correlation between the proportion of Immigrants from Pakistan and poverty level in the United States with a correlation coefficient (R) of -0.116 and weighted average of 10.8%, a difference of 2.7%.
Poverty Correlation Summary
| Measurement | Immigrants from Scotland | Immigrants from Pakistan |
| Minimum | 0.74% | 0.64% |
| Maximum | 17.6% | 22.7% |
| Range | 16.8% | 22.1% |
| Mean | 7.8% | 9.7% |
| Median | 8.2% | 9.8% |
| Interquartile 25% (IQ1) | 5.6% | 7.2% |
| Interquartile 75% (IQ3) | 9.9% | 12.2% |
| Interquartile Range (IQR) | 4.4% | 5.0% |
| Standard Deviation (Sample) | 3.5% | 4.2% |
| Standard Deviation (Population) | 3.4% | 4.1% |
Demographics Similar to Immigrants from Scotland and Immigrants from Pakistan by Poverty
In terms of poverty, the demographic groups most similar to Immigrants from Scotland are Immigrants from North Macedonia (10.6%, a difference of 0.11%), Luxembourger (10.6%, a difference of 0.19%), Eastern European (10.6%, a difference of 0.35%), Swedish (10.6%, a difference of 0.46%), and Italian (10.6%, a difference of 0.50%). Similarly, the demographic groups most similar to Immigrants from Pakistan are Czech (10.8%, a difference of 0.080%), Immigrants from Greece (10.8%, a difference of 0.13%), Cypriot (10.8%, a difference of 0.22%), Tongan (10.8%, a difference of 0.30%), and Immigrants from Poland (10.8%, a difference of 0.34%).
| Demographics | Rating | Rank | Poverty |
| Immigrants | Scotland | 99.7 /100 | #19 | Exceptional 10.6% |
| Immigrants | North Macedonia | 99.7 /100 | #20 | Exceptional 10.6% |
| Luxembourgers | 99.7 /100 | #21 | Exceptional 10.6% |
| Eastern Europeans | 99.7 /100 | #22 | Exceptional 10.6% |
| Swedes | 99.7 /100 | #23 | Exceptional 10.6% |
| Italians | 99.7 /100 | #24 | Exceptional 10.6% |
| Croatians | 99.6 /100 | #25 | Exceptional 10.6% |
| Burmese | 99.6 /100 | #26 | Exceptional 10.7% |
| Immigrants | Northern Europe | 99.6 /100 | #27 | Exceptional 10.7% |
| Immigrants | Korea | 99.5 /100 | #28 | Exceptional 10.7% |
| Greeks | 99.5 /100 | #29 | Exceptional 10.7% |
| Danes | 99.5 /100 | #30 | Exceptional 10.7% |
| Poles | 99.5 /100 | #31 | Exceptional 10.7% |
| Iranians | 99.5 /100 | #32 | Exceptional 10.7% |
| Macedonians | 99.4 /100 | #33 | Exceptional 10.8% |
| Immigrants | Poland | 99.4 /100 | #34 | Exceptional 10.8% |
| Tongans | 99.4 /100 | #35 | Exceptional 10.8% |
| Cypriots | 99.3 /100 | #36 | Exceptional 10.8% |
| Immigrants | Greece | 99.3 /100 | #37 | Exceptional 10.8% |
| Czechs | 99.3 /100 | #38 | Exceptional 10.8% |
| Immigrants | Pakistan | 99.3 /100 | #39 | Exceptional 10.8% |