Immigrants from Singapore vs Marshallese Poverty
COMPARE
Immigrants from Singapore
Marshallese
Poverty
Poverty Comparison
Immigrants from Singapore
Marshallese
10.9%
POVERTY
99.2/ 100
METRIC RATING
43rd/ 347
METRIC RANK
13.4%
POVERTY
2.2/ 100
METRIC RATING
226th/ 347
METRIC RANK
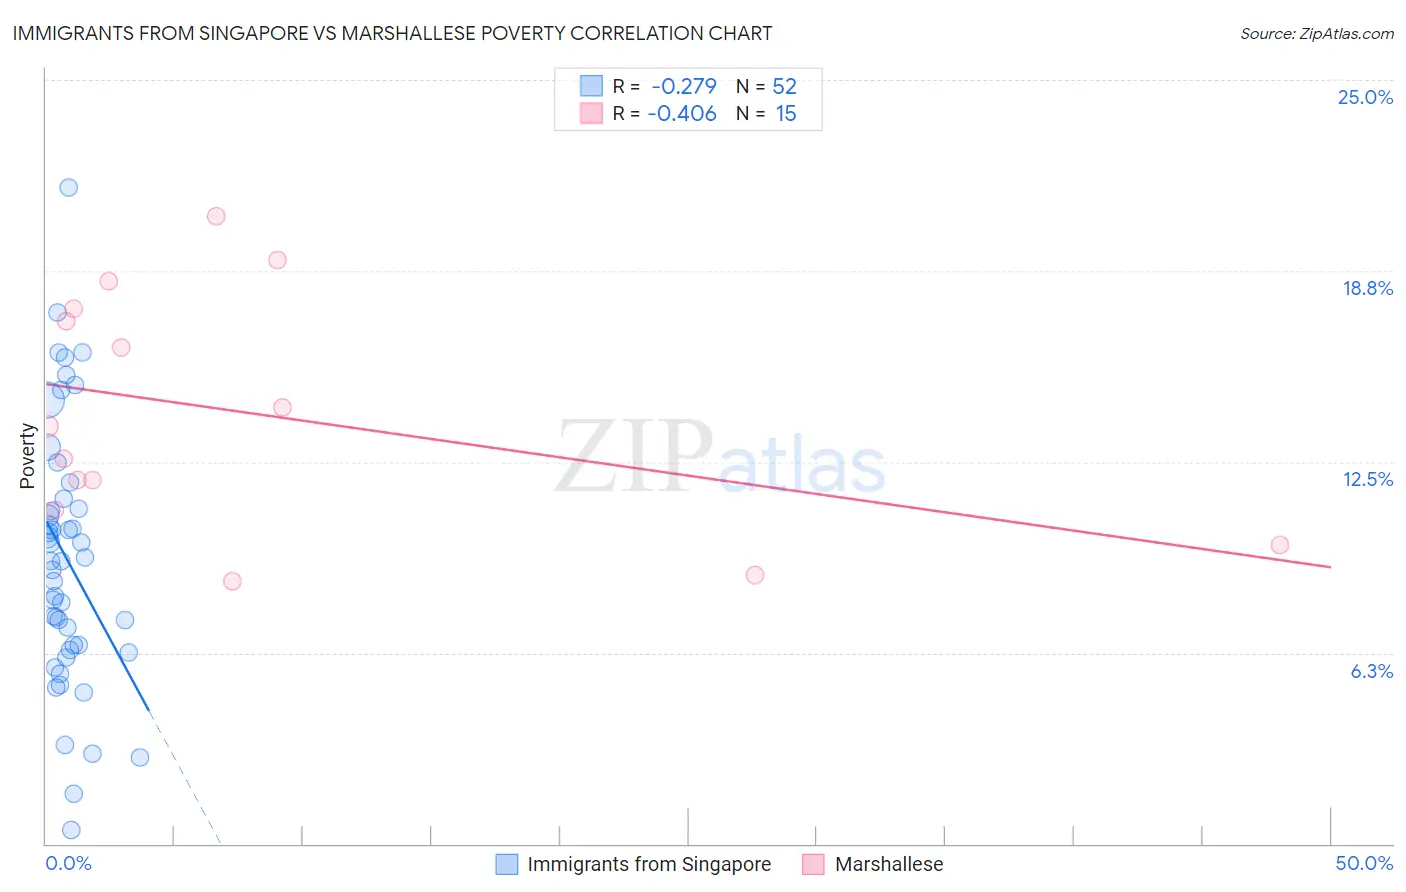
Immigrants from Singapore vs Marshallese Poverty Correlation Chart
The statistical analysis conducted on geographies consisting of 137,414,586 people shows a weak negative correlation between the proportion of Immigrants from Singapore and poverty level in the United States with a correlation coefficient (R) of -0.279 and weighted average of 10.9%. Similarly, the statistical analysis conducted on geographies consisting of 14,760,991 people shows a moderate negative correlation between the proportion of Marshallese and poverty level in the United States with a correlation coefficient (R) of -0.406 and weighted average of 13.4%, a difference of 23.5%.
Poverty Correlation Summary
| Measurement | Immigrants from Singapore | Marshallese |
| Minimum | 0.45% | 8.6% |
| Maximum | 21.5% | 20.5% |
| Range | 21.0% | 12.0% |
| Mean | 9.3% | 14.1% |
| Median | 9.2% | 13.7% |
| Interquartile 25% (IQ1) | 6.4% | 10.9% |
| Interquartile 75% (IQ3) | 11.1% | 17.5% |
| Interquartile Range (IQR) | 4.7% | 6.6% |
| Standard Deviation (Sample) | 4.3% | 3.9% |
| Standard Deviation (Population) | 4.2% | 3.7% |
Similar Demographics by Poverty
Demographics Similar to Immigrants from Singapore by Poverty
In terms of poverty, the demographic groups most similar to Immigrants from Singapore are Korean (10.9%, a difference of 0.050%), Immigrants from Moldova (10.9%, a difference of 0.14%), Immigrants from Iran (10.9%, a difference of 0.27%), Russian (10.9%, a difference of 0.36%), and Immigrants from Pakistan (10.8%, a difference of 0.41%).
| Demographics | Rating | Rank | Poverty |
| Cypriots | 99.3 /100 | #36 | Exceptional 10.8% |
| Immigrants | Greece | 99.3 /100 | #37 | Exceptional 10.8% |
| Czechs | 99.3 /100 | #38 | Exceptional 10.8% |
| Immigrants | Pakistan | 99.3 /100 | #39 | Exceptional 10.8% |
| Russians | 99.3 /100 | #40 | Exceptional 10.9% |
| Immigrants | Iran | 99.2 /100 | #41 | Exceptional 10.9% |
| Koreans | 99.2 /100 | #42 | Exceptional 10.9% |
| Immigrants | Singapore | 99.2 /100 | #43 | Exceptional 10.9% |
| Immigrants | Moldova | 99.1 /100 | #44 | Exceptional 10.9% |
| Turks | 98.9 /100 | #45 | Exceptional 11.0% |
| Immigrants | Czechoslovakia | 98.9 /100 | #46 | Exceptional 11.0% |
| Immigrants | Romania | 98.9 /100 | #47 | Exceptional 11.0% |
| Slovenes | 98.9 /100 | #48 | Exceptional 11.0% |
| Immigrants | Japan | 98.9 /100 | #49 | Exceptional 11.0% |
| Asians | 98.9 /100 | #50 | Exceptional 11.0% |
Demographics Similar to Marshallese by Poverty
In terms of poverty, the demographic groups most similar to Marshallese are German Russian (13.4%, a difference of 0.010%), Alaska Native (13.5%, a difference of 0.15%), Immigrants from Eritrea (13.4%, a difference of 0.23%), Immigrants from Africa (13.4%, a difference of 0.33%), and Immigrants from Micronesia (13.4%, a difference of 0.36%).
| Demographics | Rating | Rank | Poverty |
| Immigrants | Cambodia | 3.0 /100 | #219 | Tragic 13.4% |
| Americans | 2.9 /100 | #220 | Tragic 13.4% |
| Alsatians | 2.6 /100 | #221 | Tragic 13.4% |
| Immigrants | Micronesia | 2.6 /100 | #222 | Tragic 13.4% |
| Immigrants | Africa | 2.5 /100 | #223 | Tragic 13.4% |
| Immigrants | Eritrea | 2.4 /100 | #224 | Tragic 13.4% |
| German Russians | 2.2 /100 | #225 | Tragic 13.4% |
| Marshallese | 2.2 /100 | #226 | Tragic 13.4% |
| Alaska Natives | 2.1 /100 | #227 | Tragic 13.5% |
| Immigrants | Nigeria | 1.7 /100 | #228 | Tragic 13.5% |
| Osage | 1.5 /100 | #229 | Tragic 13.6% |
| Alaskan Athabascans | 1.5 /100 | #230 | Tragic 13.6% |
| Nigerians | 1.4 /100 | #231 | Tragic 13.6% |
| Fijians | 0.8 /100 | #232 | Tragic 13.7% |
| Immigrants | Saudi Arabia | 0.8 /100 | #233 | Tragic 13.8% |