Immigrants from Scotland vs Immigrants from Western Africa Poverty
COMPARE
Immigrants from Scotland
Immigrants from Western Africa
Poverty
Poverty Comparison
Immigrants from Scotland
Immigrants from Western Africa
10.6%
POVERTY
99.7/ 100
METRIC RATING
19th/ 347
METRIC RANK
14.1%
POVERTY
0.2/ 100
METRIC RATING
248th/ 347
METRIC RANK
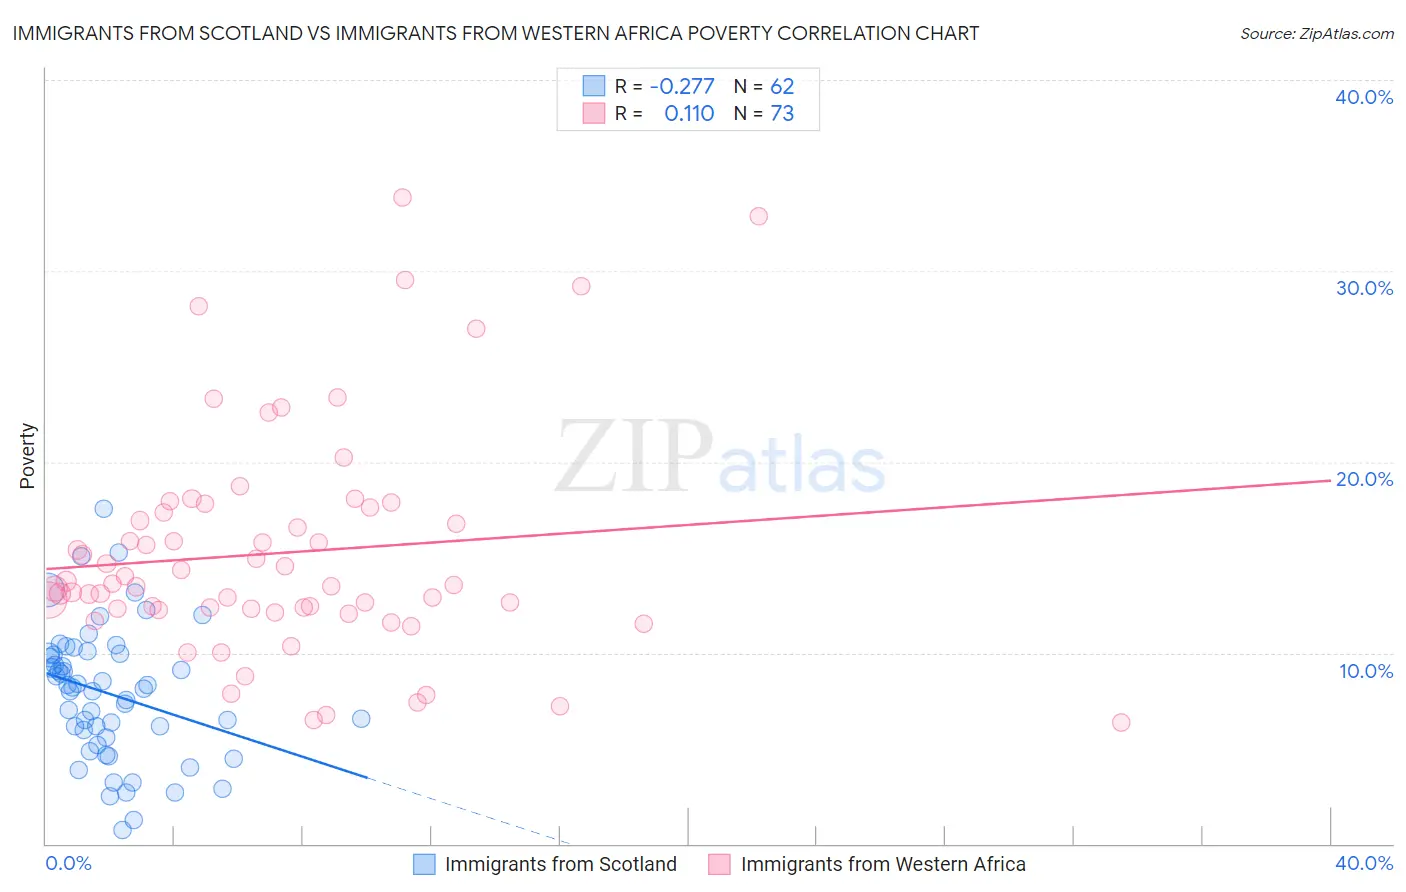
Immigrants from Scotland vs Immigrants from Western Africa Poverty Correlation Chart
The statistical analysis conducted on geographies consisting of 196,384,756 people shows a weak negative correlation between the proportion of Immigrants from Scotland and poverty level in the United States with a correlation coefficient (R) of -0.277 and weighted average of 10.6%. Similarly, the statistical analysis conducted on geographies consisting of 357,561,912 people shows a poor positive correlation between the proportion of Immigrants from Western Africa and poverty level in the United States with a correlation coefficient (R) of 0.110 and weighted average of 14.1%, a difference of 33.9%.
Poverty Correlation Summary
| Measurement | Immigrants from Scotland | Immigrants from Western Africa |
| Minimum | 0.74% | 6.4% |
| Maximum | 17.6% | 33.8% |
| Range | 16.8% | 27.5% |
| Mean | 7.8% | 15.2% |
| Median | 8.2% | 13.5% |
| Interquartile 25% (IQ1) | 5.6% | 12.3% |
| Interquartile 75% (IQ3) | 9.9% | 17.5% |
| Interquartile Range (IQR) | 4.4% | 5.2% |
| Standard Deviation (Sample) | 3.5% | 5.9% |
| Standard Deviation (Population) | 3.4% | 5.8% |
Similar Demographics by Poverty
Demographics Similar to Immigrants from Scotland by Poverty
In terms of poverty, the demographic groups most similar to Immigrants from Scotland are Immigrants from North Macedonia (10.6%, a difference of 0.11%), Luxembourger (10.6%, a difference of 0.19%), Eastern European (10.6%, a difference of 0.35%), Latvian (10.5%, a difference of 0.39%), and Swedish (10.6%, a difference of 0.46%).
| Demographics | Rating | Rank | Poverty |
| Bhutanese | 99.8 /100 | #12 | Exceptional 10.4% |
| Immigrants | Hong Kong | 99.8 /100 | #13 | Exceptional 10.4% |
| Immigrants | Bolivia | 99.8 /100 | #14 | Exceptional 10.4% |
| Bolivians | 99.8 /100 | #15 | Exceptional 10.4% |
| Lithuanians | 99.8 /100 | #16 | Exceptional 10.5% |
| Norwegians | 99.8 /100 | #17 | Exceptional 10.5% |
| Latvians | 99.8 /100 | #18 | Exceptional 10.5% |
| Immigrants | Scotland | 99.7 /100 | #19 | Exceptional 10.6% |
| Immigrants | North Macedonia | 99.7 /100 | #20 | Exceptional 10.6% |
| Luxembourgers | 99.7 /100 | #21 | Exceptional 10.6% |
| Eastern Europeans | 99.7 /100 | #22 | Exceptional 10.6% |
| Swedes | 99.7 /100 | #23 | Exceptional 10.6% |
| Italians | 99.7 /100 | #24 | Exceptional 10.6% |
| Croatians | 99.6 /100 | #25 | Exceptional 10.6% |
| Burmese | 99.6 /100 | #26 | Exceptional 10.7% |
Demographics Similar to Immigrants from Western Africa by Poverty
In terms of poverty, the demographic groups most similar to Immigrants from Western Africa are Liberian (14.1%, a difference of 0.020%), Immigrants from Ghana (14.2%, a difference of 0.090%), Potawatomi (14.1%, a difference of 0.30%), Cree (14.2%, a difference of 0.39%), and Immigrants from Burma/Myanmar (14.2%, a difference of 0.48%).
| Demographics | Rating | Rank | Poverty |
| Salvadorans | 0.4 /100 | #241 | Tragic 14.0% |
| Ecuadorians | 0.4 /100 | #242 | Tragic 14.0% |
| Sudanese | 0.3 /100 | #243 | Tragic 14.0% |
| Nepalese | 0.3 /100 | #244 | Tragic 14.0% |
| Immigrants | Sudan | 0.3 /100 | #245 | Tragic 14.1% |
| Potawatomi | 0.3 /100 | #246 | Tragic 14.1% |
| Liberians | 0.2 /100 | #247 | Tragic 14.1% |
| Immigrants | Western Africa | 0.2 /100 | #248 | Tragic 14.1% |
| Immigrants | Ghana | 0.2 /100 | #249 | Tragic 14.2% |
| Cree | 0.2 /100 | #250 | Tragic 14.2% |
| Immigrants | Burma/Myanmar | 0.2 /100 | #251 | Tragic 14.2% |
| Spanish American Indians | 0.2 /100 | #252 | Tragic 14.2% |
| Immigrants | Trinidad and Tobago | 0.2 /100 | #253 | Tragic 14.2% |
| Immigrants | El Salvador | 0.1 /100 | #254 | Tragic 14.3% |
| Immigrants | Ecuador | 0.1 /100 | #255 | Tragic 14.3% |