Immigrants from Scotland vs French Canadian Poverty

COMPARE

Immigrants from Scotland
Race
Ancestry
AfghanAfricanAlaska NativeAlaskan AthabascanAlbanianAleutAlsatianAmericanApacheArabArapahoArgentineanArmenianAssyrian/Chaldean/SyriacAustralianAustrianBahamianBangladeshiBarbadianBasqueBelgianBelizeanBermudanBhutaneseBlackfeetBolivianBrazilianBritishBritish West IndianBulgarianBurmeseCajunCambodianCanadianCape VerdeanCarpatho RusynCelticCentral AmericanCentral American IndianCherokeeCheyenneChickasawChileanChineseChippewaChoctawColombianColvilleComancheCosta RicanCreeCreekCroatianCrowCubanCypriotCzechCzechoslovakianDanishDelawareDominicanDutchDutch West IndianEastern EuropeanEcuadorianEgyptianEnglishEstonianEthiopianEuropeanFijianFilipinoFinnishFrenchFrench American IndianGermanGerman RussianGhanaianGreekGuamanian/ChamorroGuatemalanGuyaneseHaitianHmongHonduranHopiHoumaHungarianIcelanderIndian (Asian)IndonesianInupiatIranianIraqiIrishIroquoisIsraeliItalianJamaicanJapaneseJordanianKenyanKiowaKoreanLaotianLatvianLebaneseLiberianLithuanianLumbeeLuxembourgerMacedonianMalaysianMalteseMarshalleseMenomineeMexicanMexican American IndianMongolianMoroccanNative HawaiianNavajoNepaleseNew ZealanderNicaraguanNigerianNorthern EuropeanNorwegianOkinawanOsageOttawaPaiutePakistaniPalestinianPanamanianParaguayanPennsylvania GermanPeruvianPimaPolishPortuguesePotawatomiPuebloPuerto RicanPuget Sound SalishRomanianRussianSalvadoranSamoanScandinavianScotch-IrishScottishSeminoleSenegaleseSerbianShoshoneSierra LeoneanSiouxSlavicSlovakSloveneSomaliSouth AfricanSouth AmericanSouth American IndianSoviet UnionSpaniardSpanishSpanish AmericanSpanish American IndianSri LankanSubsaharan AfricanSudaneseSwedishSwissSyrianTaiwaneseThaiTlingit-HaidaTohono O'OdhamTonganTrinidadian and TobagonianTsimshianTurkishU.S. Virgin IslanderUgandanUkrainianUruguayanUteVenezuelanVietnameseWelshWest IndianYakamaYaquiYugoslavianYumanYup'ikZimbabwean
Immigration
NonimmigrantsImmigrantsAfghanistanAfricaAlbaniaArgentinaArmeniaAsiaAustraliaAustriaBahamasBangladeshBarbadosBelarusBelgiumBelizeBoliviaBosnia and HerzegovinaBrazilBulgariaBurma/MyanmarCabo VerdeCambodiaCameroonCanadaCaribbeanCentral AmericaChileChinaColombiaCongoCosta RicaCroatiaCubaCzechoslovakiaDenmarkDominicaDominican RepublicEastern AfricaEastern AsiaEastern EuropeEcuadorEgyptEl SalvadorEnglandEritreaEthiopiaEuropeFijiFranceGermanyGhanaGreeceGrenadaGuatemalaGuyanaHaitiHondurasHong KongHungaryIndiaIndonesiaIranIraqIrelandIsraelItalyJamaicaJapanJordanKazakhstanKenyaKoreaKuwaitLaosLatin AmericaLatviaLebanonLiberiaLithuaniaMalaysiaMexicoMicronesiaMiddle AfricaMoldovaMoroccoNepalNetherlandsNicaraguaNigeriaNorth AmericaNorth MacedoniaNorthern AfricaNorthern EuropeNorwayOceaniaPakistanPanamaPeruPhilippinesPolandPortugalRomaniaRussiaSaudi ArabiaScotlandSenegalSerbiaSierra LeoneSingaporeSomaliaSouth AfricaSouth AmericaSouth Central AsiaSouth Eastern AsiaSouthern EuropeSpainSri LankaSt. Vincent and the GrenadinesSudanSwedenSwitzerlandSyriaTaiwanThailandTrinidad and TobagoTurkeyUgandaUkraineUruguayUzbekistanVenezuelaVietnamWest IndiesWestern AfricaWestern AsiaWestern EuropeYemenZaireZimbabweAzores
French Canadian
Race
Ancestry
AfghanAfricanAlaska NativeAlaskan AthabascanAlbanianAleutAlsatianAmericanApacheArabArapahoArgentineanArmenianAssyrian/Chaldean/SyriacAustralianAustrianBahamianBangladeshiBarbadianBasqueBelgianBelizeanBermudanBhutaneseBlackfeetBolivianBrazilianBritishBritish West IndianBulgarianBurmeseCajunCambodianCanadianCape VerdeanCarpatho RusynCelticCentral AmericanCentral American IndianCherokeeCheyenneChickasawChileanChineseChippewaChoctawColombianColvilleComancheCosta RicanCreeCreekCroatianCrowCubanCypriotCzechCzechoslovakianDanishDelawareDominicanDutchDutch West IndianEastern EuropeanEcuadorianEgyptianEnglishEstonianEthiopianEuropeanFijianFilipinoFinnishFrenchFrench American IndianFrench CanadianGermanGerman RussianGhanaianGreekGuamanian/ChamorroGuatemalanGuyaneseHaitianHmongHonduranHopiHoumaHungarianIcelanderIndian (Asian)IndonesianInupiatIranianIraqiIrishIroquoisIsraeliItalianJamaicanJapaneseJordanianKenyanKiowaKoreanLaotianLatvianLebaneseLiberianLithuanianLumbeeLuxembourgerMacedonianMalaysianMalteseMarshalleseMenomineeMexicanMexican American IndianMongolianMoroccanNative HawaiianNavajoNepaleseNew ZealanderNicaraguanNigerianNorthern EuropeanNorwegianOkinawanOsageOttawaPaiutePakistaniPalestinianPanamanianParaguayanPennsylvania GermanPeruvianPimaPolishPortuguesePotawatomiPuebloPuerto RicanPuget Sound SalishRomanianRussianSalvadoranSamoanScandinavianScotch-IrishScottishSeminoleSenegaleseSerbianShoshoneSierra LeoneanSiouxSlavicSlovakSloveneSomaliSouth AfricanSouth AmericanSouth American IndianSoviet UnionSpaniardSpanishSpanish AmericanSpanish American IndianSri LankanSubsaharan AfricanSudaneseSwedishSwissSyrianTaiwaneseThaiTlingit-HaidaTohono O'OdhamTonganTrinidadian and TobagonianTsimshianTurkishU.S. Virgin IslanderUgandanUkrainianUruguayanUteVenezuelanVietnameseWelshWest IndianYakamaYaquiYugoslavianYumanYup'ikZimbabwean
Immigration
NonimmigrantsImmigrantsAfghanistanAfricaAlbaniaArgentinaArmeniaAsiaAustraliaAustriaBahamasBangladeshBarbadosBelarusBelgiumBelizeBoliviaBosnia and HerzegovinaBrazilBulgariaBurma/MyanmarCabo VerdeCambodiaCameroonCanadaCaribbeanCentral AmericaChileChinaColombiaCongoCosta RicaCroatiaCubaCzechoslovakiaDenmarkDominicaDominican RepublicEastern AfricaEastern AsiaEastern EuropeEcuadorEgyptEl SalvadorEnglandEritreaEthiopiaEuropeFijiFranceGermanyGhanaGreeceGrenadaGuatemalaGuyanaHaitiHondurasHong KongHungaryIndiaIndonesiaIranIraqIrelandIsraelItalyJamaicaJapanJordanKazakhstanKenyaKoreaKuwaitLaosLatin AmericaLatviaLebanonLiberiaLithuaniaMalaysiaMexicoMicronesiaMiddle AfricaMoldovaMoroccoNepalNetherlandsNicaraguaNigeriaNorth AmericaNorth MacedoniaNorthern AfricaNorthern EuropeNorwayOceaniaPakistanPanamaPeruPhilippinesPolandPortugalRomaniaRussiaSaudi ArabiaSenegalSerbiaSierra LeoneSingaporeSomaliaSouth AfricaSouth AmericaSouth Central AsiaSouth Eastern AsiaSouthern EuropeSpainSri LankaSt. Vincent and the GrenadinesSudanSwedenSwitzerlandSyriaTaiwanThailandTrinidad and TobagoTurkeyUgandaUkraineUruguayUzbekistanVenezuelaVietnamWest IndiesWestern AfricaWestern AsiaWestern EuropeYemenZaireZimbabweAzores
Poverty
Income
Poverty
Unemployment
Labor Participation
Family Structure
Vehicle Availability
Education Level
Disability

Poverty Comparison

Immigrants from Scotland

French Canadians

Exceptional
Exceptional
10.6%
POVERTY
99.7/ 100
METRIC RATING
19th/ 347
METRIC RANK
11.6%
POVERTY
91.0/ 100
METRIC RATING
111th/ 347
METRIC RANK

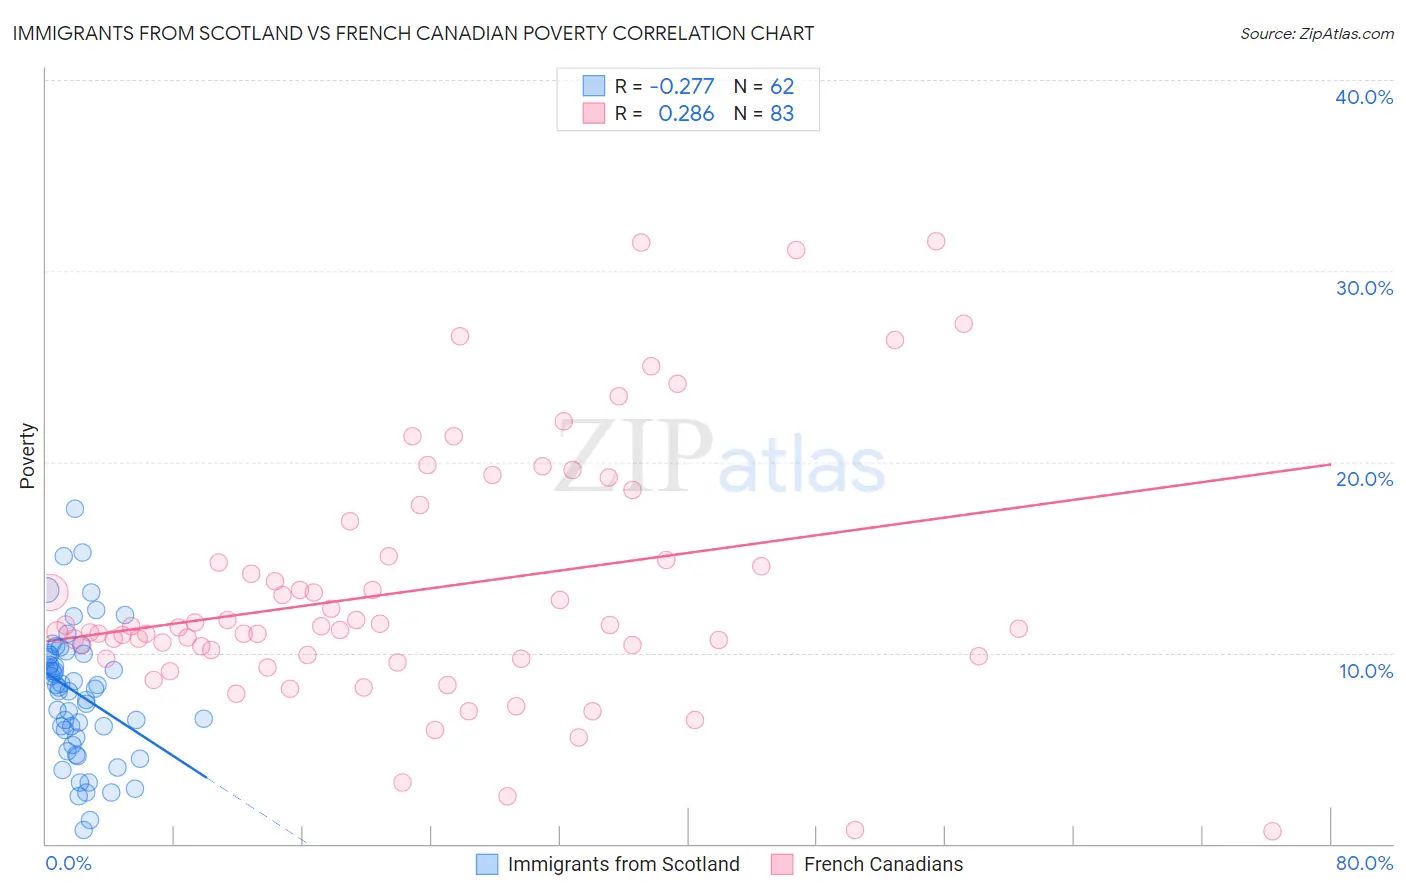
Immigrants from Scotland vs French Canadian Poverty Correlation Chart

The statistical analysis conducted on geographies consisting of 196,384,756 people shows a weak negative correlation between the proportion of Immigrants from Scotland and poverty level in the United States with a correlation coefficient (R) of -0.277 and weighted average of 10.6%. Similarly, the statistical analysis conducted on geographies consisting of 502,211,905 people shows a weak positive correlation between the proportion of French Canadians and poverty level in the United States with a correlation coefficient (R) of 0.286 and weighted average of 11.6%, a difference of 10.1%.
Immigrants from Scotland vs French Canadian Poverty

Poverty Correlation Summary

MeasurementImmigrants from ScotlandFrench Canadian
Minimum0.74%0.65%
Maximum17.6%31.6%
Range16.8%30.9%
Mean7.8%13.3%
Median8.2%11.3%
Interquartile 25% (IQ1)5.6%9.8%
Interquartile 75% (IQ3)9.9%15.1%
Interquartile Range (IQR)4.4%5.3%
Standard Deviation (Sample)3.5%6.6%
Standard Deviation (Population)3.4%6.5%

Similar Demographics by Poverty

Demographics Similar to Immigrants from Scotland by Poverty

In terms of poverty, the demographic groups most similar to Immigrants from Scotland are Immigrants from North Macedonia (10.6%, a difference of 0.11%), Luxembourger (10.6%, a difference of 0.19%), Eastern European (10.6%, a difference of 0.35%), Latvian (10.5%, a difference of 0.39%), and Swedish (10.6%, a difference of 0.46%).
DemographicsRating | RankPoverty
Bhutanese
99.8
/100
|
#12
Exceptional
10.4%
Immigrants | Hong Kong
99.8
/100
|
#13
Exceptional
10.4%
Immigrants | Bolivia
99.8
/100
|
#14
Exceptional
10.4%
Bolivians
99.8
/100
|
#15
Exceptional
10.4%
Lithuanians
99.8
/100
|
#16
Exceptional
10.5%
Norwegians
99.8
/100
|
#17
Exceptional
10.5%
Latvians
99.8
/100
|
#18
Exceptional
10.5%
Immigrants | Scotland
99.7
/100
|
#19
Exceptional
10.6%
Immigrants | North Macedonia
99.7
/100
|
#20
Exceptional
10.6%
Luxembourgers
99.7
/100
|
#21
Exceptional
10.6%
Eastern Europeans
99.7
/100
|
#22
Exceptional
10.6%
Swedes
99.7
/100
|
#23
Exceptional
10.6%
Italians
99.7
/100
|
#24
Exceptional
10.6%
Croatians
99.6
/100
|
#25
Exceptional
10.6%
Burmese
99.6
/100
|
#26
Exceptional
10.7%

Demographics Similar to French Canadians by Poverty

In terms of poverty, the demographic groups most similar to French Canadians are Immigrants from Southern Europe (11.6%, a difference of 0.070%), Immigrants from Belarus (11.6%, a difference of 0.070%), Immigrants from China (11.6%, a difference of 0.090%), Welsh (11.6%, a difference of 0.17%), and Immigrants from Turkey (11.6%, a difference of 0.21%).
DemographicsRating | RankPoverty
Native Hawaiians
92.1
/100
|
#104
Exceptional
11.6%
Portuguese
92.1
/100
|
#105
Exceptional
11.6%
Immigrants | Zimbabwe
92.1
/100
|
#106
Exceptional
11.6%
Palestinians
91.8
/100
|
#107
Exceptional
11.6%
Canadians
91.7
/100
|
#108
Exceptional
11.6%
Immigrants | Turkey
91.7
/100
|
#109
Exceptional
11.6%
Welsh
91.6
/100
|
#110
Exceptional
11.6%
French Canadians
91.0
/100
|
#111
Exceptional
11.6%
Immigrants | Southern Europe
90.8
/100
|
#112
Exceptional
11.6%
Immigrants | Belarus
90.8
/100
|
#113
Exceptional
11.6%
Immigrants | China
90.7
/100
|
#114
Exceptional
11.6%
Albanians
90.3
/100
|
#115
Exceptional
11.7%
Immigrants | Russia
89.7
/100
|
#116
Excellent
11.7%
Sri Lankans
89.4
/100
|
#117
Excellent
11.7%
Argentineans
89.1
/100
|
#118
Excellent
11.7%