Immigrants from Scotland vs Immigrants from Thailand GED/Equivalency
COMPARE
Immigrants from Scotland
Immigrants from Thailand
GED/Equivalency
GED/Equivalency Comparison
Immigrants from Scotland
Immigrants from Thailand
88.2%
GED/EQUIVALENCY
99.6/ 100
METRIC RATING
43rd/ 347
METRIC RANK
84.5%
GED/EQUIVALENCY
5.8/ 100
METRIC RATING
225th/ 347
METRIC RANK
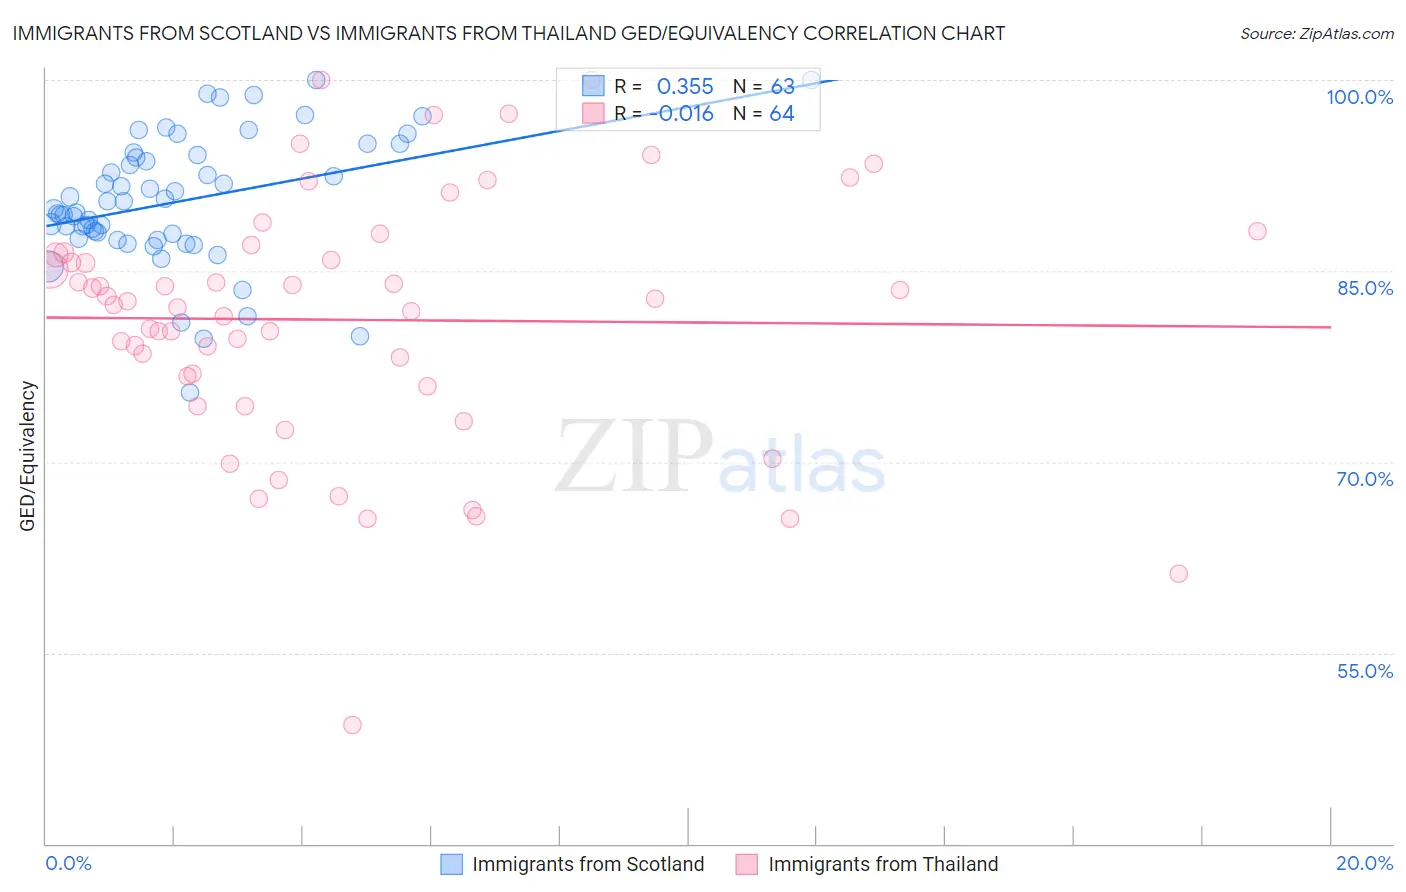
Immigrants from Scotland vs Immigrants from Thailand GED/Equivalency Correlation Chart
The statistical analysis conducted on geographies consisting of 196,397,786 people shows a mild positive correlation between the proportion of Immigrants from Scotland and percentage of population with at least ged/equivalency education in the United States with a correlation coefficient (R) of 0.355 and weighted average of 88.2%. Similarly, the statistical analysis conducted on geographies consisting of 317,022,868 people shows no correlation between the proportion of Immigrants from Thailand and percentage of population with at least ged/equivalency education in the United States with a correlation coefficient (R) of -0.016 and weighted average of 84.5%, a difference of 4.3%.
GED/Equivalency Correlation Summary
| Measurement | Immigrants from Scotland | Immigrants from Thailand |
| Minimum | 75.4% | 49.4% |
| Maximum | 100.0% | 100.0% |
| Range | 24.6% | 50.6% |
| Mean | 90.5% | 81.2% |
| Median | 89.9% | 82.5% |
| Interquartile 25% (IQ1) | 87.6% | 76.4% |
| Interquartile 75% (IQ3) | 94.1% | 86.3% |
| Interquartile Range (IQR) | 6.5% | 10.0% |
| Standard Deviation (Sample) | 5.1% | 9.8% |
| Standard Deviation (Population) | 5.1% | 9.7% |
Similar Demographics by GED/Equivalency
Demographics Similar to Immigrants from Scotland by GED/Equivalency
In terms of ged/equivalency, the demographic groups most similar to Immigrants from Scotland are Cambodian (88.2%, a difference of 0.0%), Finnish (88.2%, a difference of 0.030%), Macedonian (88.1%, a difference of 0.030%), Italian (88.2%, a difference of 0.050%), and Immigrants from Israel (88.2%, a difference of 0.070%).
| Demographics | Rating | Rank | GED/Equivalency |
| Immigrants | Belgium | 99.7 /100 | #36 | Exceptional 88.3% |
| Immigrants | Austria | 99.7 /100 | #37 | Exceptional 88.3% |
| Burmese | 99.7 /100 | #38 | Exceptional 88.3% |
| Immigrants | Israel | 99.6 /100 | #39 | Exceptional 88.2% |
| Italians | 99.6 /100 | #40 | Exceptional 88.2% |
| Finns | 99.6 /100 | #41 | Exceptional 88.2% |
| Cambodians | 99.6 /100 | #42 | Exceptional 88.2% |
| Immigrants | Scotland | 99.6 /100 | #43 | Exceptional 88.2% |
| Macedonians | 99.5 /100 | #44 | Exceptional 88.1% |
| Czechs | 99.5 /100 | #45 | Exceptional 88.1% |
| Immigrants | Switzerland | 99.5 /100 | #46 | Exceptional 88.1% |
| Immigrants | Latvia | 99.5 /100 | #47 | Exceptional 88.1% |
| Greeks | 99.5 /100 | #48 | Exceptional 88.1% |
| Australians | 99.5 /100 | #49 | Exceptional 88.1% |
| Immigrants | Korea | 99.5 /100 | #50 | Exceptional 88.1% |
Demographics Similar to Immigrants from Thailand by GED/Equivalency
In terms of ged/equivalency, the demographic groups most similar to Immigrants from Thailand are Immigrants from Zaire (84.5%, a difference of 0.020%), Immigrants from Costa Rica (84.5%, a difference of 0.040%), French American Indian (84.6%, a difference of 0.050%), Immigrants from Liberia (84.4%, a difference of 0.090%), and Immigrants from Uzbekistan (84.6%, a difference of 0.12%).
| Demographics | Rating | Rank | GED/Equivalency |
| Alaska Natives | 8.6 /100 | #218 | Tragic 84.7% |
| Potawatomi | 8.2 /100 | #219 | Tragic 84.7% |
| Americans | 8.2 /100 | #220 | Tragic 84.7% |
| Taiwanese | 8.1 /100 | #221 | Tragic 84.7% |
| Iroquois | 7.5 /100 | #222 | Tragic 84.6% |
| Immigrants | Uzbekistan | 7.1 /100 | #223 | Tragic 84.6% |
| French American Indians | 6.3 /100 | #224 | Tragic 84.6% |
| Immigrants | Thailand | 5.8 /100 | #225 | Tragic 84.5% |
| Immigrants | Zaire | 5.5 /100 | #226 | Tragic 84.5% |
| Immigrants | Costa Rica | 5.4 /100 | #227 | Tragic 84.5% |
| Immigrants | Liberia | 4.9 /100 | #228 | Tragic 84.4% |
| Immigrants | Uruguay | 4.6 /100 | #229 | Tragic 84.4% |
| Immigrants | Colombia | 4.5 /100 | #230 | Tragic 84.4% |
| Immigrants | Middle Africa | 4.3 /100 | #231 | Tragic 84.4% |
| Immigrants | South America | 4.2 /100 | #232 | Tragic 84.4% |